Travel Demand Model Results for Destination 2040 Needs Assessment
Table 1
Demographic Assumptions for the Boston Region MPO’s
2016 Baseline and 2040 No-Build Scenarios
Variable |
2016 Baseline |
2040 No-Build |
Percent Change from 2016 to 2040 |
Population |
3,178,600 |
3,524,500 |
10.9% |
Households |
1,282,100 |
1,490,600 |
16.3% |
Household Size |
2.4 |
2.3 |
-4.4% |
Total Employment |
1,890,700 |
1,999,400 |
5.7% |
Basic |
357,100 |
302,700 |
-15.2% |
Retail |
308,800 |
318,100 |
3.0% |
Service |
1,224,700 |
1,378,600 |
12.6% |
Households with Vehicles |
|
|
|
0 Vehicles |
18% |
20% |
2% |
1 Vehicle |
38% |
39% |
1% |
2 Vehicles |
26% |
24% |
-2% |
3+ Vehicles |
18% |
16% |
-2% |
Table 2
Daily Person-Trip Activity
2016 Baseline and 2040 No-Build Scenarios
Variable |
2016 Baseline |
2040 No-Build |
Percent Change from 2016 to 2040 |
Eastern Massachusetts |
|
|
|
Person Trips |
15,853,300 |
17,199,900 |
8.5% |
Auto |
13,276,400 |
14,198,500 |
6.9% |
Transit |
979,500 |
1,076,500 |
9.9% |
Non-Motorized |
1,597,500 |
1,924,900 |
20.5% |
Boston Region |
|
|
|
Person Trips |
10,991,400 |
12,012,000 |
9.3% |
Auto |
8,824,500 |
9,451,400 |
7.1% |
Transit |
821,100 |
908,800 |
10.7% |
Non-Motorized |
1,345,700 |
1,651,800 |
22.7% |
Table 3
Mode Choice
2016 Baseline and 2040 No-Build Scenarios
Variable |
2016 Baseline |
2040 No-Build |
Eastern Massachusetts |
|
|
Mode Share |
100% |
100% |
Auto Share |
84% |
83% |
Transit Share |
6% |
6% |
Non-Motorized Share |
10% |
11% |
Boston Region |
|
|
Mode Share |
100% |
100% |
Auto Share |
80% |
79% |
Transit Share |
7% |
8% |
Non-Motorized Share |
12% |
14% |
Table 4
Daily Transit-Trip Activity
2016 Baseline and 2040 No-Build Scenarios
Variable |
2016 Baseline |
2040 No-Build |
Percent Change from 2016 to 2040 |
Eastern Massachusetts |
|
|
|
Transit Trips (linked) |
979,500 |
1,076,500 |
9.9% |
Transit Trips (unlinked) |
1,322,300 |
1,453,200 |
9.9% |
Bus |
351,600 |
363,100 |
3.3% |
Bus Rapid Transit |
32,400 |
46,500 |
43.5% |
SL1, SL2, SL4, SL5, 746 |
32,400 |
37,770 |
16.6% |
SL3 |
0 |
8,730 |
-- |
Rapid Transit Lines |
811,400 |
893,500 |
10.1% |
Blue Line |
70,400 |
72,000 |
2.3% |
Orange Line |
210,000 |
231,100 |
10.0% |
Red Line |
290,000 |
318,100 |
9.7% |
Green Line |
241,000 |
272,300 |
13.0% |
Commuter Rail |
104,400 |
126,800 |
21.5% |
Ferry |
6,400 |
7,000 |
9.4% |
Express Bus |
16,100 |
16,400 |
1.9% |
Average Transfer Rate |
1.35 |
1.35 |
|
Table 5
Daily Highway-Trip Activity
2016 Baseline and 2040 No-Build Scenarios
Variable |
2016 Baseline |
2040 No-Build |
Percent Change from 2016 to 2040 |
Eastern Massachusetts |
|
|
|
Vehicle Assignment |
11,775,400 |
12,627,300 |
7.2% |
Auto |
10,134,400 |
10,845,400 |
7.0% |
Trucks |
1,641,000 |
1,781,900 |
8.6% |
Vehicle-Miles Traveled |
120,970,700 |
128,310,300 |
6.1% |
Auto |
108,508,000 |
113,314,300 |
4.4% |
Trucks |
12,462,700 |
14,209,400 |
14.0% |
Vehicle-Hours of Travel |
4,289,100 |
4,666,100 |
8.8% |
Auto |
3,843,300 |
4,125,200 |
7.3% |
Trucks |
445,800 |
518,800 |
16.4% |
Average Speed |
28.2 |
27.5 |
-2.5% |
Auto |
28.2 |
27.5 |
-2.7% |
Trucks |
28.0 |
27.4 |
-2.0% |
Average Auto Trip Length |
10.7 |
10.4 |
-2.8% |
|
|
|
|
Boston Region |
|
|
|
Vehicle Assignment |
7,813,800 |
8,377,600 |
7.2% |
Auto |
6,616,800 |
7,077,600 |
7.0% |
Trucks |
1,196,900 |
1,300,000 |
8.6% |
Vehicle-Miles Traveled |
76,519,600 |
86,050,100 |
12.5% |
Auto |
68,457,800 |
71,085,500 |
3.8% |
Trucks |
8,061,900 |
8,730,600 |
8.3% |
Vehicle-Hours of Travel |
3,002,400 |
3,524,800 |
17.4% |
Auto |
2,683,100 |
2,847,600 |
6.1% |
Trucks |
319,300 |
347,900 |
9.0% |
Average Speed |
25.5 |
24.4 |
-4.2% |
Auto |
25.5 |
25.0 |
-2.2% |
Trucks |
25.2 |
25.1 |
-0.6% |
Average Auto Trip Length |
10.3 |
10.0 |
-3.0% |
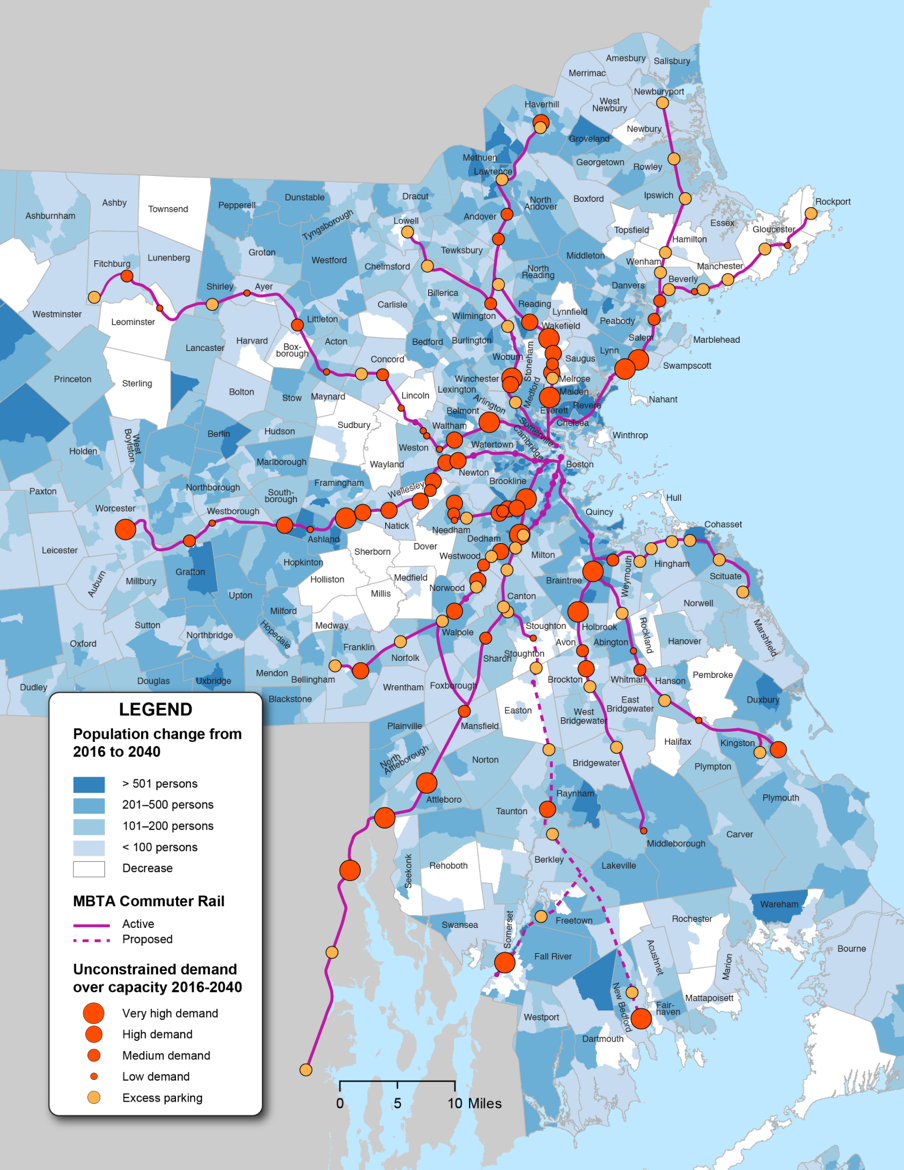
Figure 1
Commuter Rail
2040 No-Build Scenario: Parking Demand over Existing Capacity
Figure 2
Rapid Transit
2040 No-Build Scenario: Parking Demand over Existing Capacity
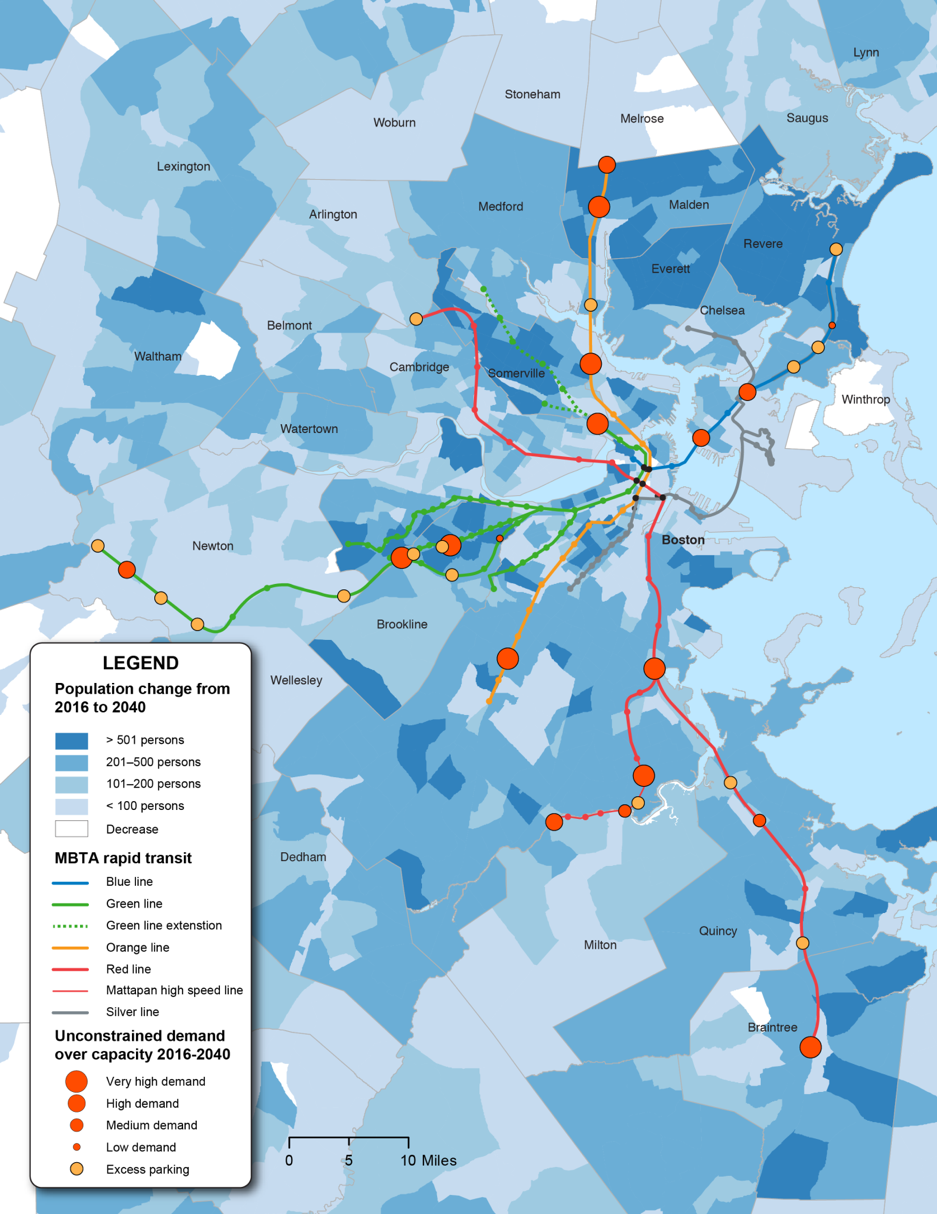
Figure 3
Priority Bus Study Corridors in the Boston Region
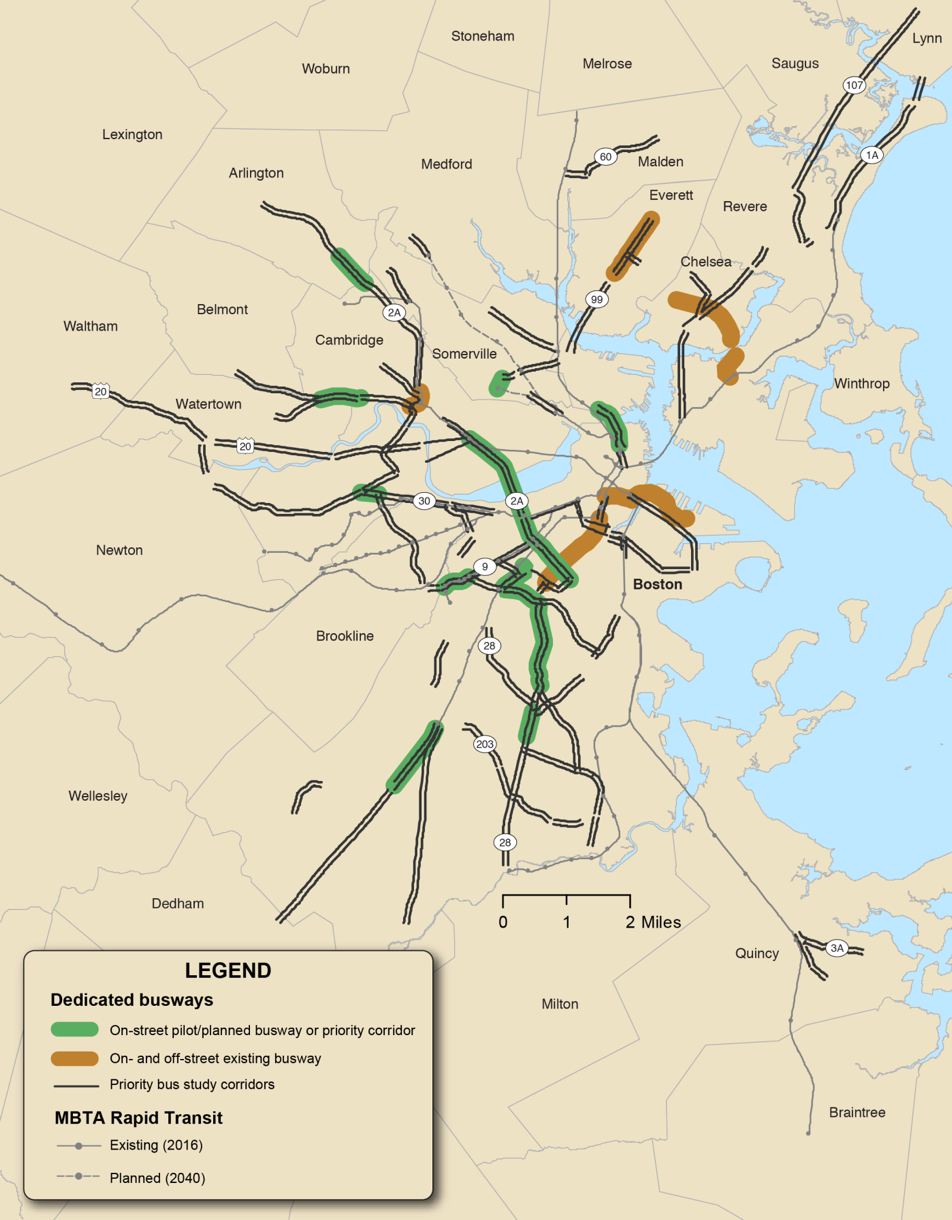
Figure 4
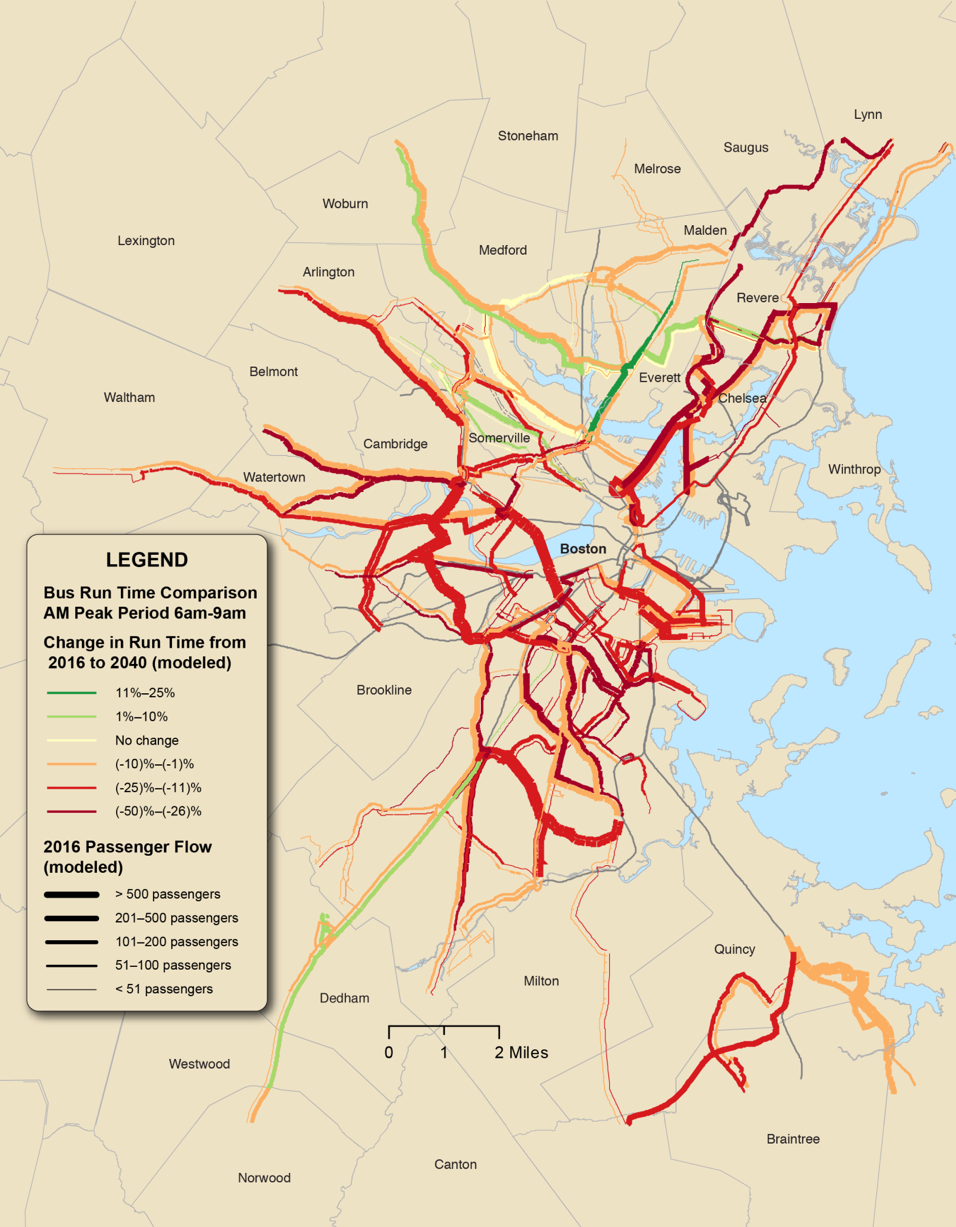
Change in Bus Run Times on High Ridership Routes
2016 Baseline and 2040 No-Build Scenarios