The National Performance Management Measures: Highway Safety Improvement Program rule identifies five performance measures related to crashes involving motor vehicles for which targets must be set:
Per Federal Highway Administration guidance, the calendar year (CY) 2026 five-year rolling average (2022–26) target-setting process began with a trend line projection based on the most recent available data. Due to the lingering impacts of pandemic-related driving conditions into 2021 and 2022, roadway fatalities were increasing relative to previous years. However, Massachusetts began to see this trend reverse in 2023, before a slight increase in 2024. As stated in the Infrastructure Investments and Jobs Act, performance targets must demonstrate constant or improved performance. In addition, like last year, the Massachusetts Department of Transportation (MassDOT) also developed a 2024–28 projection to forecast current trends further into the future. For the Boston region, fatalities showed a downward trend until 2021 but have been gradually increasing in recent years.
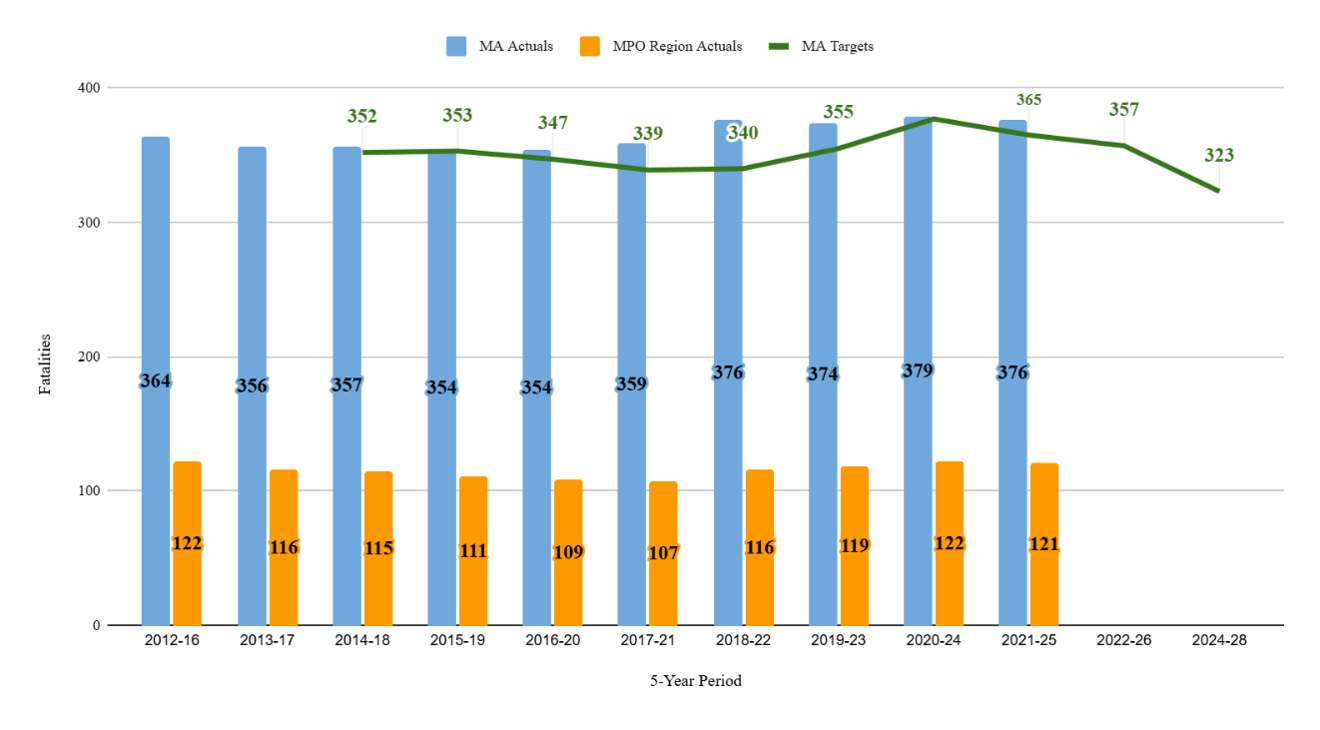
To estimate 2025 fatalities statewide, MassDOT compared data from 2015–24 to the data available at the time of target setting in July 2025. On average, 46 percent of annual fatalities occurred between January 1 and July 1 of each year. Therefore, to estimate 2025 fatalities, MassDOT divided the number to date by 46 percent. A three percent annual reduction in fatalities was then assumed to obtain an estimate for 2026, which brings the 2022–26 five-year rolling average to 357. If this three percent decrease in annual fatalities continues, MassDOT projects the 2024–28 five-year average to be 323.
Although numeric targets have been established following federal guidelines, MassDOT’s overarching goal is zero deaths and this goal will be pursued by implementing strategies from the Strategic Highway Safety Plan (SHSP). The Massachusetts SHSP and Vulnerable Road User Safety Assessment were both updated and finalized in 2023. These strategies help provide details on how the state will decrease fatalities and serious injuries.
Figure 1 shows five-year rolling averages of past state and regional performance on fatalities, as well as the state’s performance targets. The five-year rolling average target for 2022–26 is 357 fatalities.
Figure 1
Total Fatalities, State and MPO Region
MA = Massachusetts.
Sources: Federal Highway Administration, Commonwealth of Massachusetts, and Boston Region MPO Staff.
The fatality rate represents five-year average fatalities divided by five-year average VMTs. The COVID-19 pandemic greatly impacted VMT, causing fatality rates to spike in 2020 with significantly lower VMT and slightly higher fatalities. However, VMT in Massachusetts is returning to pre-pandemic levels and annual projections for 2025 are nearly in line with 2019, while 2026 projections are at level or slightly higher. Consequently, the five-year average fatality rate is estimated to be 0.56 fatalities per 100 million VMT for 2022–26. If this trend continues, MassDOT projects a decrease to 0.50 fatalities per 100 million VMT for 2024–28.
Figure 2 shows five-year rolling averages of past state and regional performance on fatality rate, as well as the state’s targets. The five-year rolling average target for 2022–26 is 0.56 fatalities per 100 million VMT.
Figure 2
Fatality Rate, State and MPO Region
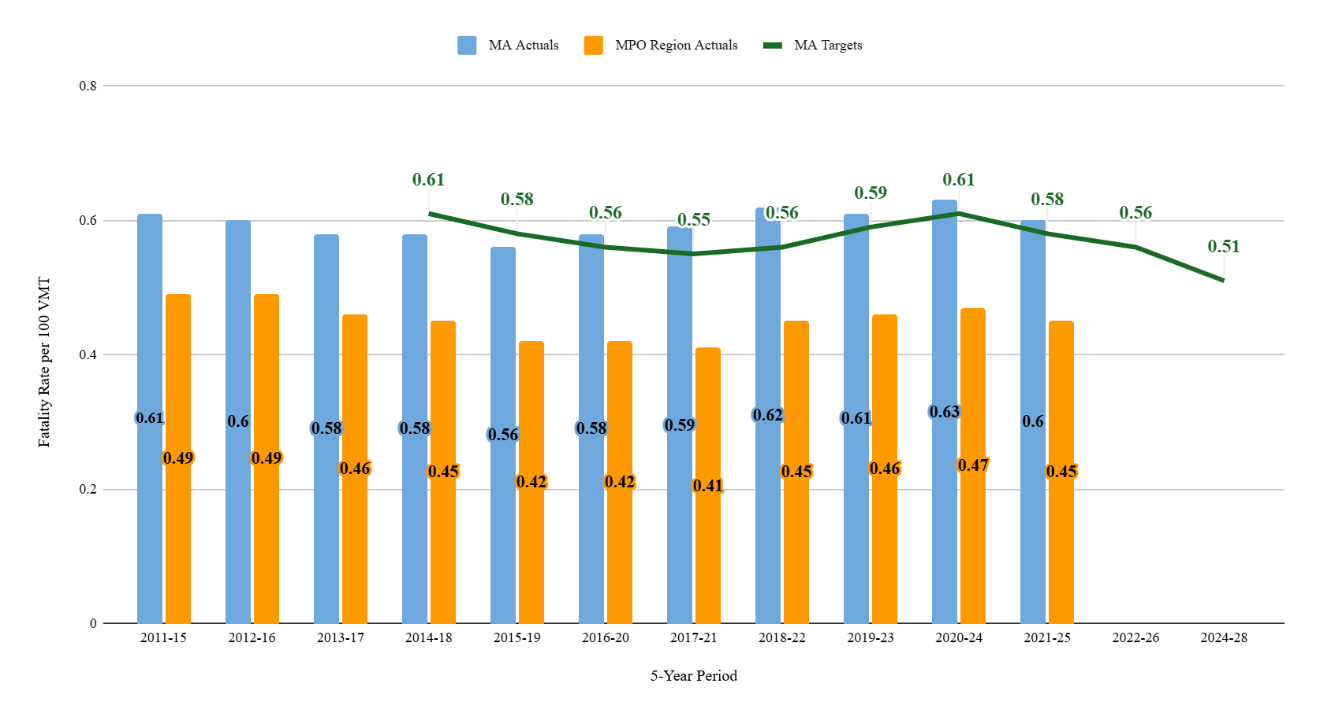
MA = Massachusetts. VMT = Vehicle-Miles Traveled.
Sources: Federal Highway Administration, Commonwealth of Massachusetts, and Boston Region MPO Staff.3.3
The target-setting process began with a trend line projection based on the most recent available data. The 2022–24 serious injury data were not finalized in the statewide crash system during this process, so it is possible that these figures will change once that data becomes final.
Due to the lingering impacts of pandemic-related driving conditions into 2021 and 2022, serious injuries increased relative to previous years. However, Massachusetts began to see this trend reverse in 2023 and 2024, but not as low as pre-COVID trends. To estimate 2025 serious injuries, MassDOT compared data from 2015–24 to the data available at the time of target setting. The number of serious injuries in 2024 to date were divided by 46 percent, the average of serious injuries that occur between January 1 and July 1 each year. A three percent annual reduction in serious injuries was then assumed to obtain an estimate for 2026, which brings the 2022–26 five-year rolling average to 2,562. If this three percent annual decrease continues, the 2024–28 five-year average of serious injuries will be 2,184.
Serious injuries in the Boston Region had dropped in the pandemic years in 2020 and 2021, increased steeply in 2023, and dropped again in 2024. A rising trend appears again for 2025.
Figure 3 shows five-year rolling averages of past state and regional performance on serious injuries, as well as the state’s targets. The five-year rolling average target for 2022–26 is 2,562 serious injuries.
Figure 3
Total Serious Injuries, State and MPO Region
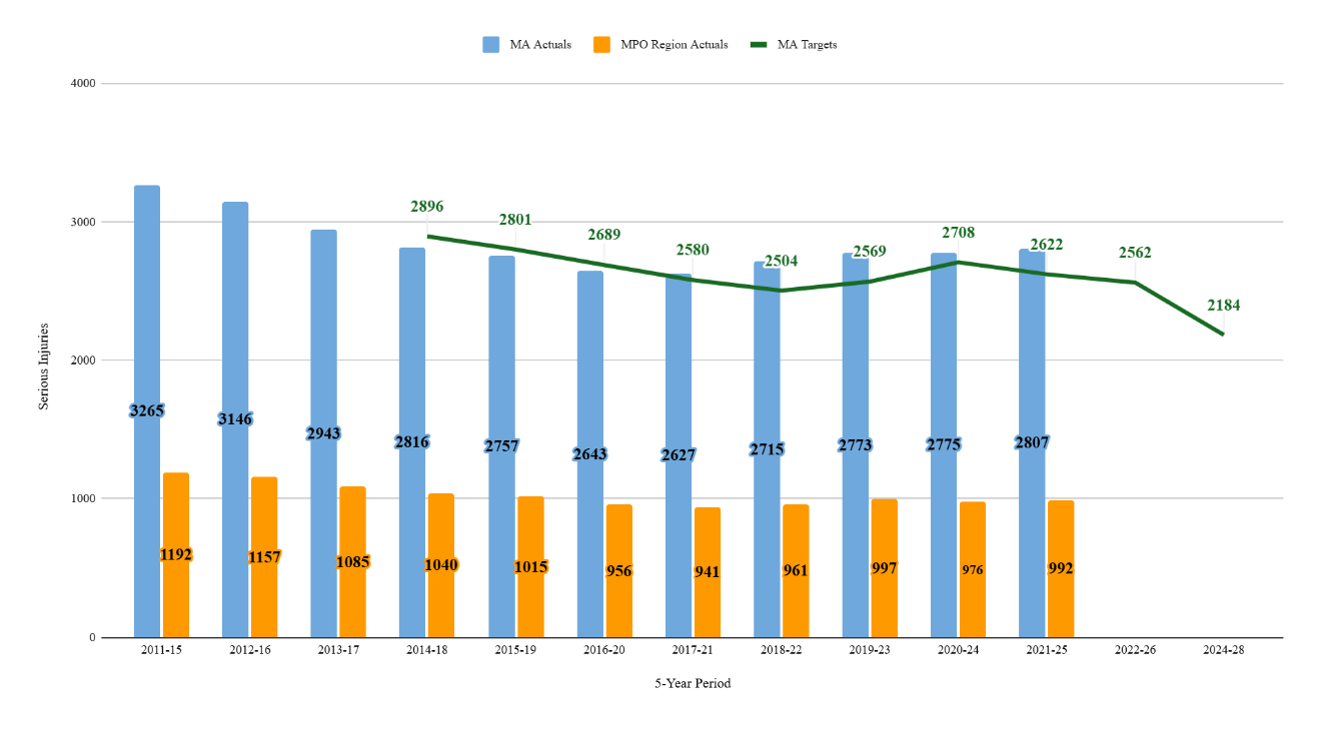
MA = Massachusetts.
Sources: Federal Highway Administration, Commonwealth of Massachusetts, and Boston Region MPO Staff.
Similar to the fatality rate, the rate of serious injuries is trending toward pre-pandemic levels. Following the same methods to derive the five-year average fatality rate, the five-year average serious injuries rate is estimated to be 4.03 serious injuries per 100 million VMT for 2022–26. If this trend continues, MassDOT projects a decrease to 3.38 serious injuries per 100 million VMT for 2024–28.
For the region, similar to fatality rates, five-year average serious injury rates dropped during the pandemic but reached pre-pandemic levels again in 2023. However, the trend seems to be reversing again in 2024 and 2025, which is a positive aspect for achieving vision zero.
Figure 4 shows five-year rolling averages of past state and regional performance on serious injury rate, as well as the state’s targets. The five-year rolling average target for 2022–26 is 4.03 serious injuries per 100 million VMT.
Figure 4
Serious Injury Rate, State and MPO Region
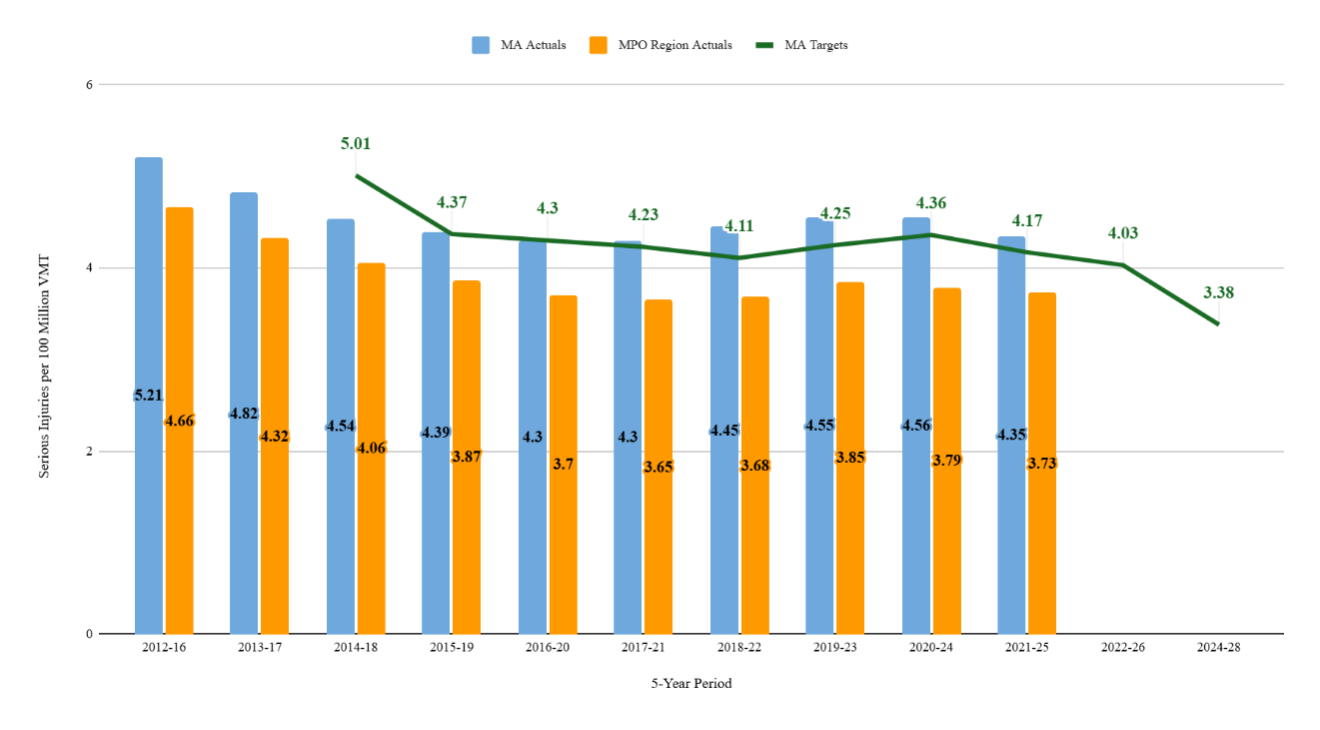
MA = Massachusetts. VMT = Vehicle-Miles Traveled.
Sources: Federal Highway Administration, Commonwealth of Massachusetts, and Boston Region MPO Staff.
The number of nonmotorized fatalities and serious injuries has fluctuated greatly in recent years. Nonmotorized fatalities, specifically, increased through 2022, decreased in 2023, increased again in 2024 and dropped in 2025. Serious injuries appear to have peaked in 2023 and have significantly decreased in 2025. On average, 45 percent of annual nonmotorized fatalities and serious injuries occur between January 1 and July 30. Therefore, to estimate 2025 fatalities, MassDOT divided the number to date by 45 percent. Based on the state’s increased efforts and emphasis on protecting vulnerable road users, a five percent annual reduction in nonmotorized fatalities and serious injuries was then assumed to obtain an estimate for 2026, which brings the 2022–26 five-year rolling average to 512. If this five percent annual decrease continues, MassDOT projects the 2024–28 five-year average to be 416.
Nonmotorized serious injuries and fatalities in the Boston region had dropped during the pandemic years but have shown an increase and have remained nearly constant since 2023, with a slight downward trend.
Figure 5 shows five-year rolling averages of past state and regional performance on nonmotorized fatalities plus nonmotorized serious injuries, as well as the state’s targets. The five-year rolling average target for 2022–26 is 512 nonmotorized fatalities and serious injuries.
Figure 5
Nonmotorized Fatalities and Serious Injuries, State and MPO Region
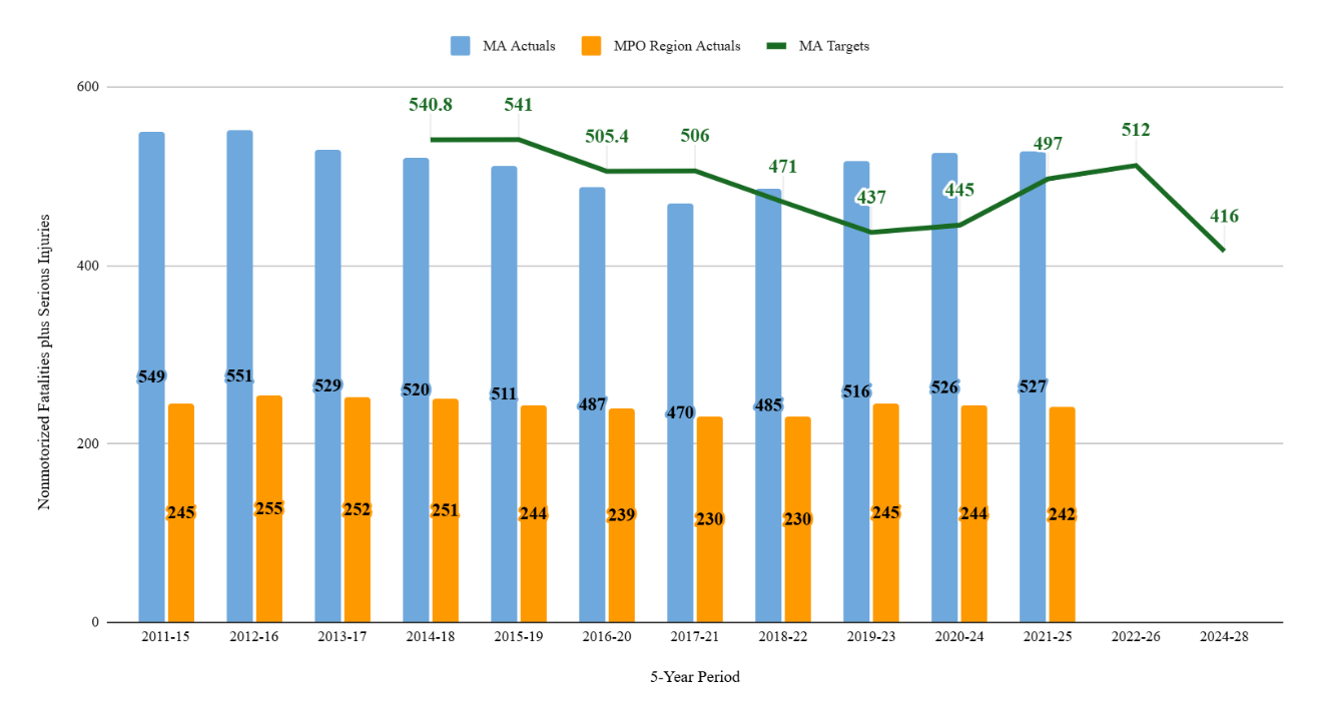
MA = Massachusetts.
Sources: Federal Highway Administration, Commonwealth of Massachusetts, and Boston Region MPO Staff.
The rolling averages of nonmotorized fatalities and serious injuries were trending downward till 2021 statewide but began an increasing trend from 2022. However, on an annual basis, nonmotorized fatalities and serious injuries have varied from year to year.1 These trends have not been captured in Figure 5.
Note: The fatality and serious injury data contained here was developed to align with the data included in MassDOT's annual Highway Safety Improvement Program report. As such, historical data may be different from what was reported in prior years.
The targets were developed in coordination with the Executive Office of Public Safety and Security, the Highway Safety Division, and other sections within MassDOT. Although MassDOT emphasizes that the state’s goal is zero fatalities and serious injuries, the state targets presented here are not “goals” but realistic targets considering the events of the last several years. The Secretary of Transportation and Highway Division Administrator for MassDOT approved the targets, recognizing that MassDOT must demonstrate short-term incremental steps to achieve the Commonwealth’s goal.
1 Serious injuries had increased between 2022–23 but are seeing a reducing trend since 2024. Nonmotorized fatalities have varied over the years with no discernible pattern. Refer to the MassDOT Impact portal for more details on nonmotorized fatalities and injuries. Available at:
Fatal crashes - https://apps.crashdata.dot.mass.gov/cdp/dashboard-view/2047
Serious Injury crashes - https://apps.crashdata.dot.mass.gov/cdp/dashboard-view/2048