October 2026
Section 2—Understanding Limited Mobility
Section 4— MPO Strategic Directions
Project Team
Project manager: Sophie Fox
Contributors: Nail Bashan, Rosemary McCarron, Emily Domanico, and David Hong
The Boston Region Metropolitan Planning Organization (MPO) is composed of state and regional agencies and authorities, and local governments.
Boston Region Metropolitan Planning Organization
State Transportation Building
Ten Park Plaza, Suite 6260
Boston, Massachusetts 02116
857.702.3700 | contact@bostonmpo.org
Nearly 18.6 million Americans reported a condition that makes travel outside the home difficult.1 For these individuals, the built environment determines not just comfort, but whether a trip is possible at all. The Americans with Disabilities Act mandates that public rights-of-way—including sidewalks, curb ramps, and transit facilities—meet minimum accessibility standards, creating a legal obligation to find and fix barriers. Traditionally, transportation planning analysis has centered on travel time and distance, and there is limited capacity to represent the trip-level conditions that shape accessibility for people with limited mobility.
Through planning and decision-making, the Boston Region Metropolitan Planning Organization (MPO) strives to promote safe, reliable, connected, and robust transportation for all those traveling throughout the region. Planners and analysts at the MPO work toward these goals by characterizing and quantifying mobility metrics, yet current methods do not always adequately reflect the perspectives of people with limited mobility.
To begin to address this gap, the MPO developed a study to better understand the perspectives of those with limited mobility as they travel throughout the Boston region. The aim was to gather information about existing efforts to represent these experiences in quantitative analysis and develop strategies for improving future transportation planning that moves beyond broad assumptions about how a typical traveler navigates the system. This information was then used to create strategies to strengthen the MPO’s data-driven decision-making capabilities and support more inclusive transportation planning.
This study consisted of three main efforts:
This report summarizes the results from these tasks and provides recommendations for future research and analysis that consider the perspectives of people with limited mobility.
For the purposes of this study, a person with limited mobility is defined as one whose physical ability to move throughout the region easily and independently is impaired. This can include older adults, people with physical disabilities that may cause them to use wheelchairs or other mobility devices, people with visual impairments, and others. This is not an exhaustive list of all those who might experience mobility limitations.
The literature review and stakeholder discussions raised the question of whether neurodivergent people, children, and those traveling with strollers and other devices should be included in this definition. While many of the topics discussed throughout this report could apply to members of these groups, it was decided that further research is needed to address the more specific challenges that they might face.
The MPO has several existing efforts that aim to understand and address the needs of people with limited mobility. People with disabilities and older adults constitute two of the six groups that the MPO designates as transportation disadvantaged populations in the Community Transportation Access Program (CTA Program), along with people of color, people with low incomes, people with limited English proficiency, and youth. The CTA Program works to advance the MPO’s goal of eliminating transportation-related gaps experienced by people in disadvantaged communities by assessing the impacts of MPO-funded projects and developing ways for all populations to meaningfully engage in the transportation planning processes that affect them.2
One major effort of the CTA Program is the Coordinated Public Transit-Human Services Transportation Plan, which “provides transportation providers with guidance to better meet the transportation needs of seniors and people with disabilities.”3 This is done by “setting regional priorities for transportation investments and initiatives for human services and public transit coordination.” The plan also provides guidance to those applying to the Massachusetts Community Transit Grant Program, which funds projects that help people with mobility limitations meet their transportation needs.
The Community Transportation Dashboard, developed as part of the CTA Program, provides a quantitative assessment of the existing conditions and identifies which populations have more or less access to important destinations and exposure to hazardous environmental conditions.4
These efforts help the MPO understand the needs of people with limited mobility, both qualitatively and quantitatively, and inform potential strategies to improve their experience navigating the transportation network. The current study aims to build upon this work by developing strategies to quantify how limited mobility reduces access to opportunities and to identify locations where improvements are needed.
The travel behavior of people with limited mobility is shaped by functional limitations, socioeconomic circumstances, land use context, and infrastructure quality. Understanding who they are, how they travel, and what they encounter along the way is a necessary foundation for representing their experience in planning analysis.
The MPO staff conducted a literature review in order to understand the contextual landscape of limited mobility, including how people with limited mobility travel and what barriers they face. To ground the literature in local experience, the study team also conducted engagement with stakeholders across a variety of disciplines.
The engagement efforts included individual and small-group interviews with 14 participants who either have disabilities or work at Councils on Aging, disability commissions, or advocacy organizations across the Boston region. Interviews were conducted virtually over Zoom and participants were recruited through email outreach to relevant organizations on a voluntary basis. Staff also participated in a series of small group conversations organized as part of the development of the Coordinated Public Transit-Human Services Transportation Plan. Staff heard from additional municipal and subregional stakeholders through attendance at sessions focused on mobility and access that were hosted by representatives from the Massachusetts Bay Transportation Authority (MBTA) and the City of Boston.
Limited mobility narrows travel in three ways at once. People make fewer trips, the trips they make take longer, and the mix of trip purposes shifts away from discretionary trips and towards necessary trips, such as trips to obtain medical care.
Research drawing on data from multiple countries estimates that people with disabilities make between 10 and 30 percent fewer trips than the general population.5 Data from the National Household Travel Survey (NHTS) supports this picture on a national scale. The 2022 survey found that over 40 percent of people aged 18 to 64 with travel-limiting disabilities made zero trips on the survey day, compared to roughly 21 percent of people without disabilities in the same age group.6 Across studies, disability is consistently associated with reduced driving and biking and greater reliance on public transit, paratransit, and rides from others.
The trips people with disabilities do make tend to take longer, even when destinations are close .7 Routes may be longer than the most direct path in order to avoid barriers, and the time required to board and alight vehicles adds to overall journey duration. Research comparing work-related and non-work trips found that the travel time imbalance between people with and without disabilities is larger for non-work trips, suggesting that the constraints imposed by limited mobility extend beyond the commute.
Trip purposes also differ. People with disabilities are more likely to make trips for medical and dental care and less likely to make work, social, or recreational trips. Among older adults with disabilities, medical trips represent the one category in which trip rates exceed those of older adults without disabilities. This pattern reflects both higher healthcare needs and the barriers that limit participation in other activities.8
Interview participants echoed this hierarchy of trip purposes and described how the importance of a destination can determine whether a trip is attempted at all. A person may endure a difficult journey to a medical appointment but skip a discretionary errand. When cost is a constraint or other travel barriers are high, social and recreational trips are often the first to be sacrificed, which several organizations linked directly to social isolation.
Reported destinations spanned medical facilities (consistently reported as the most frequent and most essential), workplaces, grocery stores and food pantries, senior centers and Councils on Aging, schools and college campuses, civic and town meetings, airports, banks, hairdressers, libraries, and parks. Participants also emphasized that people with limited mobility want to travel for the full range of reasons anyone else does. The desire for spontaneous, nonessential travel is just as present. Simply being out rather than stuck at home was described as important for mental health.
The travel disadvantages associated with disability are unevenly distributed, reflecting the intersection of disability with other dimensions of social disadvantage. The people who depend most on accessible travel often have the least access to it. Individual capacity to overcome a given barrier varies so widely that no single traveler profile represents the group.
Low-income people with disabilities face compounded barriers when accessing transportation. They are less likely to own vehicles, more likely to depend on transit and paratransit, and less able to benefit from universal access investments that tend to concentrate in more affluent areas. The result is a pattern where the populations who most depend on easy-to-navigate transportation are also the least likely to be served by it.9
Disability intersects with gender and household composition. Women with disabilities travel less than men with disabilities, and people with disabilities who live alone travel less for cultural and social activities.10 Disability also intersects with age as older adults who acquire functional limitations without identifying as disabled face many of the same barriers. The same is true for people traveling with young children, medical equipment, or assistive devices.
The information gathered from engagement with stakeholders reinforced the age dimension strongly. Older adults are a large and fast-growing population that depends heavily on transit, and mobility loss is closely tied to isolation. Participants stressed that individual capacity to overcome barriers varies widely. An obstacle that is manageable for one wheelchair user can be impossible for another. They also urged that planning account for short-term, fluctuating, and invisible disabilities. Riders with invisible disabilities are often denied seats on crowded vehicles, and participants argued that no one should have to disclose a condition in order to use a mobility device.
Participants also highlighted caregivers as an essential aspect of access and mobility. Many home care aides rely on public transit to reach the people they support, which makes transit connections to care facilities and assisted-living sites a condition of care delivery, not just a convenience for residents. The cost of travel compounds these obstacles. For some, even subsidized transportation options remain out of reach. Low-income people with limited mobility often face the fewest viable options at the highest personal cost.
The presence of a sidewalk says little about whether someone can use it. The quality of sidewalk and crossing infrastructure is essential in maintaining safe and comfortable walking and rolling trips for people with limited mobility. There are many obstacles that make these trips riskier.
Sidewalk pavement problems were the most frequently cited environmental barrier among people using assistive mobility devices.11 For people with visual impairments, uneven surfaces impair depth perception and increase the risk of trips and falls, and many avoid walking in areas with uncertain footing. For people using mobility aids, rough or narrow pathways and poorly designed dropped curbs generate risks of tipping and instability. Even features that are intended to aid navigation can create problems. Tactile paving supports orientation for people with visual impairments but causes fatigue and instability for mobility aid users, creating a documented tension between accessibility features that serve different populations.12
The absence of adequate benches and seating is another barrier that is easy to overlook in standard infrastructure assessments. For travelers who need to rest while walking, insufficient seating can make certain trips infeasible regardless of the quality of other infrastructure elements. Similarly, vehicles parked temporarily on sidewalks, outdoor dining furniture, trash bins, and other forms of street clutter create unpredictable obstacles that are particularly difficult to navigate for people with visual impairments.13
Interviews verified the sidewalk-quality findings and added local specifics. Participants described sidewalk gaps as a fundamental barrier that can leave people stranded, even when a fixed transit route is nearby but unreachable on foot, forcing some to walk or roll in the road. Curb cuts were a recurring concern. They sink and develop ridges over time and ramps treated as afterthoughts are often too steep to use. In many locations they do not exist. Several wheelchair users pointed to an aging streetscape where traffic lanes are maintained before sidewalks.
Boston's historic fabric came up repeatedly. Brick and cobblestone streets make wheelchair travel painful, can catch canes, and can throw a rider from the chair when a wheel snags. Participants identified Back Bay side streets in Boston specifically as having holes and missing bricks and noted that deep cuts and gaps have blocked access to transit stations. Some participants, however, reported that with the right assistive device, poor sidewalk condition is rarely prohibitive, reinforcing that capacity varies by individual.
Vegetation and ground-level obstacles were widely cited. Overgrown bushes, overhanging vegetation, and tree roots pushing sidewalk slabs upward pose particular risks to people with visual impairments. Crosswalk design also came up frequently. Pedestrian push-buttons placed too high or set back off the curb are out of reach for wheelchair users, signal timing is often too short, drivers frequently fail to stop, and accessible pedestrian signals are sometimes broken or ineffective. Quiet electric vehicles were flagged as hard to detect, especially for those with visual impairments who rely on auditory cues, with some backup warning tones resembling safe-to-cross signals. Flashing beacons and accessible pedestrian signals (APS) were also mentioned as important tools. Their absence can leave people with limited mobility feeling unsafe at crossings and force longer detours to find a crosswalk they can comfortably use.
Temporary obstructions were a distinct theme. Construction zones make paths narrower and more dangerous when poorly marked. Parked vehicles and bikes blocking sidewalks or curb ramps, and trash cans left out on the sidewalk create real barriers.
Navigation itself is a separate challenge. Orientation is difficult in the region's irregular street network, and the lack of tactile markings and auditory wayfinding compounds the problem.
Cycling infrastructure, or the lack thereof, can present challenges for people with limited mobility, both for pedestrians who must interact with cyclists and for those who are cyclists themselves. Infrastructure that is not designed for adaptive bicycles excludes riders when racks, barriers, and turning radii are built around a standard bike. Infrastructure that is well designed for cyclists can create hazards for others, for example where a bike lane crosses the path to a bus stop or an accessible drop-off.
Cycling can offer independence and health benefits for people with limited mobility who find walking or taking transit difficult. However, people with disabilities cycle at substantially lower rates than the general population. Studies included in a systematic review of disability and travel behavior found biking utilization rates between 0.8 and 2.2 percent among people with disabilities, compared to a range of 1.2 to 38 percent in the general population across the same studies.14 Infrastructure conditions can be a central barrier. Existing cycle infrastructure often fails to accommodate adaptive cycles. The wider, lower profiles of adaptive bikes create conflicts with anti-vehicle barriers and shared-use paths. Also, end-of-trip access requires navigating from bike path to sidewalk to parking, and their larger dimensions make securing a spot at a standard rack difficult or impossible.
E-bikes are an emerging option that can lower the physical barrier to cycling for people with limited mobility.15 However, the ownership costs combined with limited charging infrastructure present a significant access gap. Safety presents an additional challenge. The higher speeds of e-bikes increase crash severity, and the likelihood of hospitalization following a crash is higher for older cyclists and those with physical constraints.
Participants who cycle described a range of barriers consistent with the literature and added detail on adaptive equipment. Due to adaptive and handcycle riders’ limited visibility, the absence of continuous protected infrastructure becomes a bigger safety concern, mitigated only by flags, flashing lights, and riding with a companion. Trails are often not designed or maintained for adaptive bikes, so transitions between sidewalks, streets, and trails often do not offer a wide enough turning radius. Also, traffic signal buttons are frequently out of reach from someone on an adaptive bike.
Bike-share and bike parking were described as largely inaccessible. Systems such as Bluebikes offer no adaptive options, and racks and bike parking at transit stations cannot accommodate handcycles. Participants noted that making it easier to securely store attachable handcycles at transit stations would greatly increase independence. On the road, participants cited potholes, construction detours that are hard to navigate, and new construction creating bumps that pop tires.
A distinct engagement theme was the interaction between cycling infrastructure and people with limited mobility who are not themselves cycling. Reactions to floating bus stops were mixed as some found them disorienting while others found them to be a nonissue. However, visually impaired participants consistently described the danger of having to cross a bike lane to reach a floating stop. Fast e-bikes and cyclists who run lights, ride on sidewalks, or race past people on shared-use paths add unpredictability. Guide dogs are not specifically trained to recognize bike lanes and cane users often cannot detect them. Several participants also flagged conflicts where bike lanes run through accessible pick-up and drop-off zones, blocking curbside RIDE drop-offs and ramp deployment.
People with limited mobility need accessible physical infrastructure and accessible services to use public transit and rideshare comfortably. Obstacles span features of transit stops, stations, and vehicles; the lack of temporal and geographic coverage of transit and paratransit services; and rideshare services that are ill-equipped to support people with limited mobility.
Within the fixed-route public transit network, accessibility depends on transit connectivity, vehicle design, and station infrastructure. Public transit riders who require step-free access face substantially longer journeys than other riders on the same network, because inaccessible stations force itineraries off rail and onto slower routings with more interchanges and longer transfers.16
A 2023 study into one-seat rides (transit trips that do not require any transfers between routes or services) analyzed origin and destination flows of work commutes.17 These data were paired with location data for transit routes and stops to see which origin-destination pairs were best served by direct transit service. If analysts at the MPO were to combine a similar methodology with information about where people with limited mobility live and travel to work, school, medical appointments, and other essential destinations, it would be possible to determine which areas of the Boston region provide the best transfer-less travel, and which areas are at the highest priority for intervention and increased service.
Bus stop design is a documented source of difficulty. Floating bus stops and shared bus stop border arrangements, which require pedestrians to cross a bike lane to reach the bus, consistently reduce feelings of safety and confidence among people with disabilities, in some cases leading to avoidance of bus services altogether. Slopes at bus stop bypasses were also reported to pull wheelchairs sideways or complicate boarding and alighting. Stop heights and pavement designs vary even between stops on the same route, undermining riders' ability to plan trips with confidence. By contrast, curb-free layouts were associated with increased independence and confidence, and participants suggested that audio announcements upon alighting could improve safety.18
Heavy rail and subway stations present a distinct set of challenges. Where elevators or escalators are absent or out of service, stations become inaccessible to riders who cannot use stairs. Even a station that meets accessibility requirements can become effectively inaccessible when equipment fails or goes offline for maintenance. When such disruptions are not communicated in advance, people with limited mobility may arrive only to find the accessible route unavailable. Ferry boarding introduces an additional source of variability: the gap between dock and vessel changes with water level, making boarding conditions less predictable than at fixed rail platforms. Across all three modes, accessibility in practice depends on equipment reliability and staff presence in ways that nominal service designations do not capture. When asked what features matter most, people with mobility impairments consistently identified level boarding platforms, non-slip surfaces, ramps with suitable inclines, and sufficient space for wheelchair maneuverability. Riders treat these features as minimum requirements for independent travel rather than enhancements.19
The design of transit vehicles is also a barrier. Steps at vehicle thresholds, gaps between platforms and vehicles, and the absence of ramps can prevent boarding altogether, and poor bus alignment with curbs can hinder ramp deployment even where ramps exist. Once aboard, people with visual impairments may struggle to identify the correct stop when schedule information is not readily available.20 Electric and hybrid vehicles, which emit little sound at low speeds, create an additional hazard for travelers with visual impairments who rely on engine noise to detect an approaching vehicle.21 Even when vehicles are accessible in design, crowding can render wheelchair spaces effectively unavailable, forcing passengers with mobility impairments to wait for a subsequent vehicle or abandon the trip.
Paratransit services serve an important role for travelers who cannot use fixed-route transit. However, these services are widely documented as unreliable, inflexible in terms of service hours and geographic coverage, and sometimes difficult to access due to eligibility requirements. Most paratransit services also segregate users with disabilities from the general traveling public, which compounds the social isolation that limited mobility can already produce.
A MassDOT review of community transit needs across Massachusetts found that many of the most common concerns surrounding Council on Aging (COA) vans, demand response services, and ADA paratransit include the availability of the service (in terms of service hours, geographic coverage, and capacity) and the inability to fully access the service, whether it be because they do not offer door-to-door rides or because they require advanced scheduling. COA vans in particular also tend to only support a limited set of trip types, often only providing service to medical appointments, grocery shopping, senior centers, and other pre-defined errands.22
In 2019, Metropolitan Planning Council conducted a study which involved creating an index that measured paratransit availability in the Chicago area.23 This index incorporates information such as the hours of paratransit service availability, how far in advance a ride has to be reserved by a user, and the presence of overlapping services. This index is used in conjunction with a fixed-route transit availability index and transit demand data to produce a measure of transportation gaps for people with disabilities. By collaborating with paratransit service providers within the Boston region to gather data about their service areas and policies, the MPO can work to provide a similar result.
Engagement with stakeholders produced MBTA-specific details on public transit experience and barriers. On platform-to-vehicle interfaces, participants described height and distance gaps that require a wheelie or a ramp to board, introducing a particular challenge for power chairs with large wheels. Riders described sometimes being unable to get an operator's attention for a ramp and therefore unable to board. Low-floor Green Line trolleys were praised as offering a much better experience than high-floor cars with ramps.
Within stations, participants cited problems in elevators with controls on only one side, riders getting stuck in an elevator when unable to maneuver to a button, tight approach angles that require spinning a chair, and phone-scan-only fare gates at South Station that close on riders. Public transit that is only accessible in one direction sometimes requires riders to travel in the wrong direction and circle back, and some elevators were taken out of service due to winter snow and ice. Front-only fare tapping on Green Line trolleys forces riders who enter through the rear to go up a set of stairs to pay fares.
On-board conditions matter too. Overcrowding leaves too little seating and forces riders to stand and balance. Rush hour compounds this crowding and is especially burdensome for riders who need to reach an appointment at a fixed time or who must pay for rideshare to avoid crowding in buses during commuting hours. Needing to be strapped down into a wheelchair space adds several minutes of dwell time. Commuter rail cars often have only one wheelchair-accessible spot, which may already be occupied by luggage, strollers, or another rider, leaving no space for the next wheelchair user. Major events such as concerts or sports games add another layer of unpredictability. Surge pricing, relocated stops, and temporary signage not designed for accessibility can strand riders who scheduled trips without knowing an event was underway. Ambient noise makes announcements hard to hear. Deaf-blind participants cannot use electronic signage or audio and expressed the need for tactile wayfinding. Buses frequently cannot pull to the curb because of trees, utility poles, snow, or illegally parked vehicles, and stops may not be shoveled during winter.
Paratransit and rideshare drew extensive comment, expanding on the literature's reliability findings. The RIDE (the MBTA's paratransit service) and similar services must be booked well in advance (a Monday trip may require a Friday call) and can arrive far earlier or later than scheduled, causing missed appointments or long waits. The return-trip pickup after an appointment was described as especially stressful, as an appointment start time is much more predictable than an appointment end time. While The RIDE offers door-to-door service, many other paratransit services provided by Councils on Aging and other organizations are only curb-to-curb, which is not enough for some riders. A new policy that defines limits to the weight size of parcels riders may bring on the paratransit vehicles, and the extent to which drivers can help carry these items, has made grocery and airport trips with medical equipment infeasible for some riders.
Both wheelchair-accessible rideshare vehicles and trained drivers are in short supply. Participants also reported being denied access with a service animal, last-second cancellations when a rideshare driver sees a cane or dog, and drivers touching riders or animals without consent. Some riders reported cycling through multiple drivers before finding one willing to accommodate them and noted that holding drivers accountable for such behavior is difficult. Locating the correct vehicle and a clear accessible path, surge pricing during medical trips, and cancellations of trips to outlying towns are all additional problems reported by participants.
Trips that cross municipal lines or boundaries of regional transit authorities’ (RTA) service areas were described as especially difficult. A trip that involves more than one RTA service area can become a full-day undertaking, and some destinations lack any adequate transit connection at all. Few Councils on Aging extend service into Boston, a hub for medical care and other important destinations, and coordination between RTAs and the MBTA was described as unreliable, since traffic and congestion undercut on-time transfers even when each service runs on schedule.
Driving is considered the most independent option available to people with limited mobility. Surrendering a drivers’ license is emotionally and logistically challenging, especially in car-centric cities. If alternatives to driving are not available, mobility is severely impacted. For those who still drive, parking availability and curb geometry may still limit their ability to reach their destination.
A systematic review of studies on daily travel behavior found wide variation in driving rates among people with disabilities, ranging from 2.6 to 82.7 percent depending on disability type and study context. Even when a vehicle is available, independence can be limited by several factors, including loss of license or inability to obtain one, the cost of vehicle adaptations, and dependence on another driver. As a result, on average, people with disabilities drive less than the general population and rely more on transit, taxis, and rides from others.24 According to an analysis of adults aged 60 and older living in eastern Massachusetts municipalities, 60 percent of people with a disability either do not drive or limit their driving in some way (refraining from driving at night, in bad weather, or in unfamiliar locations) compared to only 19 percent of people without a disability.25
Driving cessation is among the better-documented transitions in the aging and mobility literature and is consistently linked to worse mental health outcomes. A systematic review of 42 studies found that driving cessation is significantly associated with depression, anxiety, and broader declines in mental health among older adults. These outcomes are moderated by social engagement, sense of control, time since cessation, and the availability of alternative transportation.26 Because driving is often the default mode for many adults in car-dependent societies, few plan for this transition proactively. Identifying alternative transportation options before driving stops is recommended but these options depend on the transport infrastructure already being in place, which varies considerably across communities.27
Losing the ability to drive emerged as an emotionally significant transition in the interviews as it represents a loss of independence and autonomy. Councils on Aging staff reported that it is difficult to persuade older adults to stop driving even when it may be unsafe, and without a trusted support network the transition becomes even harder and more anxiety-inducing. Participants suggested that more available transit options would make encouraging this mode shift easier.
For those who still drive, curbside conditions are a barrier in their own right. Accessible parking spaces are often occupied by drivers making brief stops or blocked by illegally parked vehicles, and at commuter rail stations parking spaces are sometimes sited so that a parked vehicle blocks the ramp. Curb height and length are unpredictable; a curb may be too short for exiting a vehicle, or a deployed ramp may land on a fence or on the sidewalk. Resident-permit-heavy areas of Cambridge and Boston often lack accessible visitor spaces, and the same competition for curb space keeps service workers from reaching the people they serve. Paying at standard parking meters is difficult from a wheelchair. Parking apps help, but a digital divide leaves some riders unable to pay by smartphone.
Participants also framed accessible parking as a broader need. The underlying requirement for shorter walks from parking to destinations applies across a wider range of ages and abilities than current accessible designations reflect.
Weather's impact on travel goes beyond discomfort. In winter, snow fills curb cuts and buries the tactile cues that make a path usable. On hot summer days, a slower trip means a longer window of heat exposure and therefore greater health risk.
Environmental conditions create barriers for people with limited mobility that are distinct from physical infrastructure deficiencies. Travel rates among people with mobility disabilities are significantly lower on snowy days and when temperatures fall below freezing, with daily trip rates dropping by roughly 25 percent under such conditions compared to fair-weather days.28 Many assistive devices are especially sensitive to weather. Electric mobility scooters are often not rain resistant, and battery performance in power wheelchairs degrades under extreme heat. Weather also compounds the usability of infrastructure that is otherwise functional. Tactile paving becomes slippery when wet, and the visual contrast that partially sighted people rely on to detect surface transitions is covered by snow.
Heat presents a compounding physiological challenge for individuals with limited mobility. A walk on a hot day might feel longer than the same walk on a cooler day. The lack of shade, benches for resting, or shelters at bus stops can make trips especially dangerous for older adults and people with disabilities who might have a difficult time regulating body temperature.
A transit heat exposure model built for Atlanta assigns separate physical activity profiles to older adults and wheelchair users, since their bodies accumulate heat stress at different rates than younger adults doing the same activity.29 The model found that waiting and walking segments, particularly ingress and egress, drive most of the heat exposure accumulated over a trip. Wheelchair users who wheel to their final destination faced notably longer egress times, extending their exposure window. Egress segments also carried far higher heat risk than ingress segments, since heat accumulated earlier in a trip carries over and compounds later in the journey.
Weather was among the most frequently discussed barriers, especially snow and ice. Unclear or inconsistent responsibility for clearing sidewalks leaves paths unshoveled or cleared too narrowly. Snow is dumped into curb cuts, and after storms the tactile clues visually impaired travelers rely on disappear while glare from snow challenges those with light sensitivity. Snow and ice affect even people who have someone to drive them, and several participants went days without traveling in winter because getting around the snow was not worth the hassle. The RIDE sometimes limits service to essential medical trips in snowy conditions.
Heat and rain were also emphasized. Hot asphalt and lack of shade are hard on service animals, so some owners choose to stay home during hot days. Some Councils on Aging reported canceling trips on extremely hot days, and people reported that paratransit services sometimes have broken air conditioning, making long trips dangerous. One wheelchair user pointed out that people with disabilities sometimes have difficulty regulating their internal temperature, which makes traveling on hot days particularly unsafe. Wheelchair users described how wet surfaces reduce traction leading them to avoid trips in the rain, though good curb cuts can mitigate this risk. Participants stressed that environmental factors compound one another. For example, poor lighting plus ice significantly amplifies fall risk.
Lighting and time of day recurred as environmental barriers. Insufficient lighting discourages nighttime travel and can contribute to isolation. Some participants can drive only in daylight, so short winter days further limit evening access. Bright headlights or rapid light-to-dark transitions are difficult for people with certain eye conditions, who do best with steady, even lighting.
Representing limited mobility in quantitative planning requires data on both travel behavior and infrastructure conditions. The American Community Survey (ACS) is the MPO's primary consistent source of disability data at the regional level, but it carries well-documented limitations that analysts should weigh when relying on it. It also has limited information about travel, so it cannot show whether a difficulty constrains a trip. Small-area estimates carry wide margins of error. Despite this limitation, the ACS remains a useful way to locate populations with disabilities across the region.
In this section, we review the primary sources available for trip and infrastructure data and assess their utility for regional accessibility analysis. Then we examine what becomes possible when pedestrian conditions are recorded at a high resolution.
The National Household Travel Survey (NHTS), administered by the Federal Highway Administration (FHWA), is the primary national source of data on personal travel behavior in the United States.30 The NHTS captures disability through a self-reported question asking whether the respondent has “a temporary or permanent condition or handicap that makes it difficult to travel outside of the home.” This framing identifies people with travel-limiting disabilities specifically, rather than disability in a clinical or administrative sense.
The survey provides very detailed answers to person-, trip-, and household-related questions.31 In addition to whether they have a disability that makes travel difficult, respondents are asked questions about their race, income, and the number of vehicles in their household. They are also asked if their travel is limited at all as a result of their disability, and other trip-related questions such as whether respondents limited driving to daytime, used bus or subway less frequently, asked others for rides, or used rideshare due to their condition or disability. Analyzing this data can help formulate patterns about which sociodemographic variables relate to certain trip characteristics. However, despite this level of detail, the single travel-diary day format also means that trip suppression (staying home entirely) is recorded but infrequent trip-makers may be underrepresented.
One flaw with this survey is that the data is at a low spatial resolution. While there is information about what census block group a respondent lives or travels in, the block groups themselves are not publicly available. The highest level of detail available about the respondent is whether they live in the New England Census Division, whether the Metropolitan Statistical Area they live in has more than one million people, and if that area has heavy rail. While this will not provide insight into individual trip patterns, it could be useful in determining differences in populations and their choices based on the characteristics of the geographic locations they live and travel in. It is also possible to request the detailed geographic information from FHWA that is not publicly available.
The Massachusetts Travel Survey, conducted by the Massachusetts Department of Transportation (MassDOT) in partnership with the state's regional planning agencies, is the most comprehensive regional household travel survey for Massachusetts. The most recently completed survey was conducted in 2012 and a new statewide survey was launched in 2024, but data from the new survey were not yet publicly available at the time of this report. The survey captures mode, trip purpose, departure time, and origin-destination pairs geocoded to X/Y coordinates, offering higher spatial resolution than national surveys.32 Disability-relevant variables in the 2012 survey include disabled license plate status and disabled transit registration, as well as a non-travel reason field that explicitly codes “homebound, elderly, or disabled” as a distinct category. The survey also records paratransit and dial-a-ride as travel modes, enabling identification of riders with mobility constraints.
The MBTA's automated fare collection system offers a partial window into mobility-limited ridership on the fixed-route network. Transportation Access Pass (TAP) card transactions can serve as a proxy for riders with disabilities, since eligibility for these programs requires documentation of a qualifying condition.33 This approach captures actual boarding locations and trip frequency at fine spatial and temporal resolution, without relying on self-reported survey data. However, it identifies a subset of eligible riders who have enrolled in the fare program, and reveals nothing about trip purpose, destination, or the barriers that may have shaped route and mode choice.
Data on The RIDE represent another potential source of information about the travel needs of people with significant mobility limitations. The geography of RIDE trips and the residential distribution of registered users could indicate where fixed-route transit is failing to serve people with disabilities and where complementary investments in accessible infrastructure may be most needed. The utility of these data for regional analysis depends on the form and accessibility of the underlying records. The MBTA does not publish RIDE data publicly in an origin-destination format, limiting its utility for spatial analysis.34
The MBTA's System-Wide Passenger Survey, known as the Rider Census, offers the most direct survey-based window into mobility-limited ridership on the system.35 The survey has run on a rolling annual basis since 2022 to meet Federal Transit Administration Title VI requirements. Each response describes a recent trip, capturing origin and destination, trip purpose and trip frequency alongside standard demographic items such as age, gender, ethnicity and income. The instrument also asks respondents whether they identify as having a disability or condition that makes using the MBTA more challenging, what type of disability they experience, what functional limitations they face, what mobility aids they use, and whether they travel with a service animal. These items make it possible to characterize how riders with disabilities travel and where, and to pair self-identified limitations with reported origins, destinations, and access modes. However, the sample is inherently limited to riders who were able to reach a surveyed station or stop, excluding people with disabilities who could not access the system at all, which complicates any attempt to use these data to characterize the broader population of people with limited mobility in the region.
The Cape Ann Transportation Authority (CATA) and the MetroWest Regional Transit Authority (MWRTA) are regional transit authorities, and they cover communities on the region's northeastern and western edges. Both run fixed-route bus service, ADA paratransit, and on-demand microtransit. Both report to the National Transit Database (NTD), which counts unlinked passenger trips by mode. The NTD classifies microtransit as demand response, so demand response counts combine ADA paratransit, dial-a-ride, and microtransit trips. These figures carry no origin, destination, trip purpose, or rider characteristics, and nothing in them identifies disability status. The statewide Transportation Access Pass gives riders with disabilities a reduced fare on both systems, but it documents eligibility rather than recording rides. The Greater Attleboro Taunton Regional Transit Authority (GATRA), Montachusett Regional Transit Authority (MART), Lowell Regional Transit Authority (LRTA), and Brockton Area Transit Authority (BAT) each serve a few MPO municipalities. Their NTD data carries the same limits.
OpenStreetMap (OSM) is a globally maintained, crowd-sourced geographic database that includes a rich tagging schema to capture features of active transportation infrastructure. Sidewalk records encode information about surface material, smoothness, incline, width, the presence of curbs, and the suitability of a path for wheelchair users. Crossing records capture signalization, lighting, the presence of a median island, and whether the crossing also serves cyclists. These attributes correspond closely to the infrastructure characteristics identified in the literature as important to people with limited mobility. OSM also has information about what type of bicycle facility is present along a given roadway. MPO staff have used OSM data to calculate level of traffic stress for cyclists along roadways based on this facility information paired with vehicle movement data.
OSM's tagging schema has been used as a foundation for accessible routing and network analysis. Its sidewalk, bicycle facility, and crossing attributes can be used to construct pedestrian and biking networks that distinguish between paths based on their suitability for different mobility profiles, enabling analyses that go beyond simple connectivity to account for some of the physical characteristics of the walking environment. However, the completeness and accuracy of OSM data vary considerably by geography. Coverage in the Boston region is generally better in dense urban areas than in suburban or rural locations, and the accessibility-specific tags are less consistently applied than the basic street network data. OSM is a valuable but imperfect complement to other data sources. It can provide significant analytical leverage in areas where it is well-maintained, but quality assessment is required before use in accessibility analyses. Participants in engagement efforts frequently cited sidewalk and infrastructure issues as a primary barrier to travel, so building out a robust network with information about sidewalk infrastructure quality could be instrumental in identifying accessibility gaps throughout the region.
The MBTA and RTAs publish transit data in the General Transit Feed Specification (GTFS) format, which includes several fields relevant to accessibility analysis.36 ,37 Stop-level records indicate whether wheelchair boarding is possible at each location, and trip-level records flag individual trips as wheelchair accessible. Station pathway data are particularly valuable for station-level analysis as they describe the physical connections within stations (including walkways, escalators, and elevators) along with path lengths and the stops they connect.
These data provide a useful starting point for identifying accessible infrastructure in the network, but they have important limitations. Accessibility is recorded as a binary designation, without capturing the condition, reliability, or usability of the relevant infrastructure. The GTFS data also do not capture stop-level amenities (shelters, seating, tactile markings, or lighting) that affect whether a stop is usable in practice. Supplementary data sources are therefore needed to characterize actual accessibility conditions at the stop and station level. The MBTA Lightweight Application for Measuring Performance (LAMP) team compiles archives of alerts about the system’s facilities. LAMP provides information about alerts regarding elevators, escalators, platforms, entrances, and more, which can be used to identify where there are frequent accessibility issues.38
The MBTA's Plan for Accessible Transit Infrastructure (PATI) program involved the production of a data layer that records every stop in the MBTA bus network with accessibility and amenity attributes drawn from a 2017 system-wide audit of bus assets.39 Each record includes sidewalk condition at the stop, the presence of shelters and benches, whether amenities obstruct the path of travel, and the condition and dimensions of the landing pad. PATI priority scores classify each stop as Compliant, High, Critical, Medium, or Low based on the original audit, and a separate status field tracks current progress toward compliance with the Americans with Disabilities Act (ADA). PATI compliance status was last updated in December 2025 and the underlying amenity attributes such as seating, trash bins, and trees reflect 2017 conditions. Because municipalities are responsible for bus stop upkeep, compliance progress is uneven across the region.
In terms of service-related data, the GTFS also provides useful information that can help determine the accessibility of public transit for people with limited mobility. The “transfers” text file has data about whether a given location is a recommended transfer point between routes, or if it would be difficult to make that transfer.40 It also has minimum transfer times needed for people walking and using wheelchairs. GTFS’s route and trip data can also be used to determine the extent to which individual trip patterns would be feasible for someone with limited mobility. Participants in engagement activities identified how difficult transfers can be, and how the need to transfer can determine whether a trip is made at all, so this is important information to have access to.
MassDOT provides three pedestrian infrastructure datasets. The Pedestrian Curb Cuts layer contains point locations of curb ramps on MassDOT-owned roadways, including condition and inspection data.41 The Pedestrian Facilities layer was created using aerial photography to indicate whether sidewalks are present on the left, right, or both sides of the road, and attributes including facility type, surface type, and sidewalk width are indicated.42 However, pedestrian attributes are populated for only a small fraction of segments, limiting the dataset's utility for network-wide analysis. MassDOT also has a crosswalks dataset. This dataset, produced through an object detection model, identifies the crosswalk type (zebra, parallel, or other), location (intersection, midblock, etc.), and other attributes.43
Boston's sidewalk inventory, completed by the City of Boston Public Works Department, covers individual sidewalk segments with fields including material, width, slope, a Sidewalk Condition Index, damage dimensions, and curb type.44 Attributes unlikely to change over time, such as width and slope, remain useful for accessibility analysis. However, the inventory reflects a single 2014 field campaign with no apparent resurvey since, so condition-dependent fields such as the damage dimensions and Sidewalk Condition Index should be interpreted with caution given the decade-long gap.
The City of Cambridge published a sidewalk layer derived from a 2018 photogrammetric base mapping project.45 The data were captured from an April 2018 aerial flyover. Each sidewalk segment includes surface type (bituminous, concrete, brick, or unpaved), total width, length, and grade, which are critical attributes for wheelchair users and others sensitive to slope. The dataset does not include condition data, and as a photogrammetric product it reflects what was visible from the air at the time of capture rather than a ground-level accessibility audit. Its coverage extends to the 6.4 square miles of Cambridge.
Boston's 311 service request data, published continuously through Analyze Boston, offers a resident-reported picture of the current status of active transportation infrastructure.46 In the first five months of 2026 alone, the system logged roughly 2,800 sidewalk repair requests, all geocoded and timestamped. These records capture where residents reported problems, so the data can be spatially biased toward areas with higher digital engagement and more active 311 use. Yet the complaint stream offers a baseline condition picture and signals sidewalk deterioration nearly in real time in a way that no other local dataset currently provides.
Engaged stakeholders also suggested that 311 could be leveraged more deliberately. Participants described using 311 to report snow and ice blocking access and noted that it could be used more broadly to identify sidewalk-quality issues. Meanwhile, the digital divide among older adults is a reminder that complaint data under-represents residents less comfortable with app-based reporting.
The Downtown Boston Neighborhood Association's Streets and Sidewalks database, produced by the One Downtown Task Force in July 2025, is the most granular pedestrian condition dataset available. The survey covered virtually every crosswalk, ramp, accessible ramp, and sidewalk in Downtown Boston and Chinatown, cataloging nearly 1,000 photographs and applying AI-generated condition scores on a 1–10 scale based on surface evenness, trip hazards, and obstructions. The database illustrates what high-resolution, current-condition, active transportation infrastructure data looks like in practice.47
WalkBoston is a pedestrian advocacy organization in Massachusetts that has conducted walk audits across municipalities in the Boston area.48 Walk audits bring together people with wide-ranging perspectives to observe sidewalk and road conditions along a defined route, producing reports with summaries, short-term recommendations, and long-term recommendations aimed at making streets safer and accessible for all users. Walk audits can also inform issues spanning hazard preparedness, heat mitigation, and economic development. Walk audit reports do not produce a scalable geospatial dataset. However, they offer granular and ground-level observations from trained eyes and lived experience that official inventories cannot capture. Reports include clear guidance on where problems exist, how to prioritize them, and what interventions are most needed.
Shared Spaces is a coalition made up of advocates from various organizations in and around Boston that works to promote safety and accessibility in public places.49 One of its efforts in the city of Boston was to create a city-wide map of where protected bike lanes run adjacent to accessible public parking spots. Engaged stakeholders identified these conditions as problematic, as protected bike lanes and the cyclists who travel through them can often make it difficult to deploy ramps for mobility devices (see Section 2.4). Identifying these locations provides an opportunity for accessibility improvement.
Street-level accessibility data collection has traditionally fallen to local and state governments. Employing field crews that use digital levels and measuring tapes remains the dominant approach, one that is slow, expensive, and difficult to scale. Emerging technologies are changing what is achievable at network scale.
Project Sidewalk is a web-based tool that enables online volunteers to remotely label pedestrian accessibility conditions by virtually navigating city streets in Google Street View.50 Contributors place georeferenced sidewalk accessibility labels to mark curb ramps, sidewalk obstacles, and surface problems. Each label can be assigned a severity rating, where the highest value denotes an impassable barrier. Labeled data are accessible via a public API that returns georeferenced clusters and neighborhood-level accessibility scores in GeoJSON format. Cities and municipalities can request a deployment by contacting the research team at the University of Washington. The process requires strong local partners such as advocacy organizations or government officials able to help recruit and sustain a volunteer community.
Boston is not currently among the cities covered by Project Sidewalk. However, through an initiative with a local middle school in Waltham, the tool does have a presence in the Boston region.51 Civics students at the school led an effort that completed the labeling process for about 9 percent of the city.52 This is a good start, but there is still a long way to go until this tool is applicable on a regional scale.
The accuracy of Project Sidewalk labeling is dependent on Google Street View imagery, which is updated on an irregular cadence. This limitation constrains its use for current ADA compliance assessments. Despite its limitations, Project Sidewalk represents one of the few large-scale, open crowdsourced datasets on pedestrian infrastructure conditions and offers a replicable methodology that could be extended to the Boston region. New initiatives like the one in Waltham and partnerships with planners and other stakeholders can organize efforts to build out networks in more of the region’s municipalities.
Recent advances in computer vision and depth estimation are expanding what is measurable in the pedestrian environment, offering faster and cheaper alternatives to traditional field surveys. The first approach reconstructs three-dimensional sidewalk geometry from ordinary video.53 Researchers processed roughly one minute of consumer-camera footage through Neural Radiance Fields to produce sidewalk models detailed enough to extract the geometric features that determine ADA compliance such as running slope, cross slope, and the vertical lips between concrete slabs that create trip hazards. Against high-end LiDAR as a benchmark, the method correctly classified compliance in roughly 97 percent of cases and outperformed both smartphone-based LiDAR and manual instruments on slope accuracy and trip hazard detection. Its main limitation is processing time. Each site requires approximately 20 minutes on a high-performance GPU, constraining throughput for large-area assessments.
The second approach uses computer vision to read sidewalk conditions directly from streetscape imagery.54 Liu et al., (2024) trained image recognition models on volunteer-labeled photos from Project Sidewalk. The models reliably identified conditions such as missing tactile warnings on curb ramps and parked vehicles obstructing the sidewalk, and the approach scales easily to large areas. It identifies whether a condition is present, but not its severity or by how much it exceeds an ADA threshold. It also depends on Google Street View imagery that can lag real conditions by several years.
These two approaches demonstrate opposite ends of a precision-scale tradeoff. A third direction could bridge them by combining routinely collected video (such as the forward-facing cameras already mounted on transit buses) with monocular depth estimation models such as Depth Anything V2.55 Applied to existing video feeds, such a pipeline could measure trip hazard heights and surface slopes across an entire network without dedicated field surveys, offering a cost-effective path toward continuous ADA compliance screening at regional scale. Video collected by these cameras can also capture behavioral data such as flashing beacon compliance and parking in bike and bus lanes, as well as infrastructure data such as bus stop amenities and conditions after snow events. One limitation to this data is that it would only be available along bus routes themselves. This tool would need to be paired with a supplemental method to fill out the rest of the network.
Standard routing tools return the shortest path from origin to destination, but the shortest available path can be inaccessible for people with limited mobility. Even where routing services offer a single “ADA-compliant” option, environmental barriers are relational rather than absolute, so applying one fixed standard to all users misses the variation in how individuals actually weigh route attributes. Previous studies suggest that different vertical displacements were associated with different stress responses, and unpaved sidewalks appeared to generate higher stress primarily among participants using wheel-based assistive devices.56 Slick surfaces under rain or snow carry substantially higher costs than the same surfaces in dry conditions, an interaction that static routing algorithms cannot accommodate.57 These findings motivate a set of tools designed to characterize the pedestrian environment with greater resolution and user sensitivity than conventional data sources allow. The following subsections review approaches relevant to the MPO's data-driven access analysis efforts.
This study’s engagement effort provided direct support for the premise that route choice is relational and user specific. Some participants with limited mobility described a preference for longer but more comfortable and familiar routes over shorter ones. People mentioned that they detour around brick and cobblestone surfaces, construction, and unsafe crossings, and sometimes select inconvenient paths to avoid obstructions. Minimizing transfers in the transit system was described as a major factor in deciding where and how to travel. Each additional transfer increases the stress of a trip and the potential that a single out-of-service elevator could strand a rider mid-journey. These accounts argue for routing that reflects individual thresholds, familiarity, transfer burden, and real-time reliability rather than a single compliance flag.
The City of Amsterdam's AI Team developed an open-source accessible route planning tool to address the mobility challenges faced by individuals with limited mobility in urban environments.58 The tool constructs a multimodal network incorporating sidewalks, bicycle lanes, signalized crossings, and transit stops and generates personalized routes based on user-defined accessibility thresholds. Users specify a minimum acceptable sidewalk width, a maximum curb height, and a preference for sidewalk or bike lane routing. The tool then identifies a path from a given origin to destination that satisfies those constraints.
Network construction proceeds through a series of data processing steps. The tool draws on two Dutch national datasets. Sidewalk widths are derived from the topographic registry geometry and added as impedance weights in the network. The elevation model is used alongside Cyclomedia street-level point clouds to calculate curb heights at crossings, allowing the tool to filter or flag crossings that exceed the user-specified maximum. Crossings are generated from OSM intersection features, Project Sidewalk crowdsourced labels, and traffic sign locations.
The tool demonstrates how high-resolution urban data can support accessibility analysis at the network level. However, its current form has notable limitations for direct transfer to other contexts. The topographic registry geometry and elevation model datasets used here are specific to the Netherlands, and the tool is designed to generate a single route between a fixed origin-destination pair rather than network-wide performance metrics. Adapting this approach to the Boston region would require identifying equivalent local data sources for topography, land use, and street-level infrastructure, as well as methods for generating crossing and curb conditions at comparable resolution.
Standard road network datasets capture vehicle travel well but treat sidewalks as secondary, with coverage varying significantly by location. Two related initiatives from the Taskar Center for Accessible Technology (TCAT) at the University of Washington address this gap directly. TCAT developed OpenSidewalks as an open data specification for pedestrian network mapping.59 Rather than tagging a path as simply “accessible” the OpenSidewalks schema stores the individual physical attributes that determine accessibility such as sidewalk width, surface type, slope, and presence of curb ramps. This approach leaves the accessibility determination to the routing application and the user's specific constraints. The schema is compatible with OpenStreetMap but extends it with an accessibility-forward structure that makes sidewalks, crossings, and curb ramps essential network elements.
OS-CONNECT is a statewide pedestrian network dataset for Washington State, built on the OpenSidewalks data schema and developed by TCAT. Data collection combines machine learning with human vetting. Pedestrian infrastructure is automatically detected using ML methods, and the resulting features are then reviewed, corrected, and augmented by human mappers using the OpenSidewalks tagging schema, in coordination with local jurisdictions and communities. The resulting dataset covers sidewalks, crossings, and curb ramps statewide, reaching areas where roughly 90 percent of Washington's population lives. OS-CONNECT also underlies AccessMap, a personalized pedestrian routing app that lets users set their own thresholds for parameters such as maximum uphill and downhill incline and whether to require curb ramps at intersections. However, OS-CONNECT currently covers Washington state and no equivalent statewide dataset exists for Massachusetts, and comparable sidewalk attribute data for the Boston region is sparse.
The MBTA Trip Planner includes an accessible trip planning tool that allows users to plan journeys filtered by wheelchair accessibility. The tool excludes stations without accessible features and offers options for the most direct routes or those requiring the least walking, giving riders with mobility limitations meaningful control over their travel experience. For users who rely on elevators, step-free boarding, or accessible platforms, this represents a significant practical improvement over a standard trip planner that treats all stations as equivalent.60
However, beyond physical mobility, the tool's accessibility criteria do not address the full range of disability types. Travelers with visual impairments, cognitive disabilities, or hearing loss face distinct barriers that wheelchair accessibility filters do not capture, such as the availability of audio announcements, tactile wayfinding, or simplified route presentation. The trip planner website also indicates that temporary elevator outages and alerts are not always reflected in the trip suggestions, meaning that someone relying on the tool might not have real-time updates about the accessibility of their trip. If the rider is an older adult with limited experience with technology, using this tool on the website or mobile app is even more difficult.
Additionally, the access segments connecting a traveler's origin to the transit network, such as sidewalks, curb ramps and intersection crossings, are outside the planner's scope, meaning a route flagged as accessible may still begin with a first-mile segment that is impassable. A more comprehensive accessible trip planner would integrate active transportation infrastructure data for the access leg and adopt a broader definition of accessibility that reflects disability type and the varied needs of all riders.
After completing the literature review and stakeholder engagement, MPO staff held a series of strategy sessions to discuss the knowledge gained from the first two tasks and develop strategies to better represent the experiences of people with limited mobility in future work. The participants of these sessions spanned multiple teams and roles in the agency, including data analysts and scientists, transportation planners, and specialists in focus areas such as equity and safety. The following sections describe some of the main ideas that emerged from these discussions.
Incorporating the perspectives of people with limited mobility into regional transportation planning requires examining the MPO’s role in advancing accessible planning principles. Throughout the strategy session conversations, participants kept coming back to universal design principles. Planners and analysts alike believe that planning for those with mobility limitations tends to also benefit a broad range of users. However, the MPO is not an implementing agency. It does not have any direct authority over infrastructure design features in the Boston region. Despite this limitation, the MPO has ways to advance these principles.
One way that the MPO can work to improve accessibility is by revisiting regional accessibility guidelines. The criteria currently used to designate transit stations as accessible may not fully reflect real-world usability, and the distinction between physical access and usability is important. The MBTA lists the accessibility features of all subway, commuter rail, and ferry stations. These features could include elevators and escalators, tactile markings, and high-level platforms for boarding. For example, the Central Square Red Line station has two listed accessibility features: an up-only escalator and an elevator.61 A station may be made technically accessible by these features, but could require a back entrance, narrow sidewalks, and steps at the final destination making the end-to-end trip unusable. Elevator presence alone does not guarantee accessible entry and exit, and infrastructure quality matters considerably. Street design work incorporates ADA standards as a baseline, but whether those standards fully reflect the needs of people across the spectrum of mobility limitations is uncertain.
MassDOT publishes a Project Development and Design Guide, which details guidelines and requirements for the design of accessible bus stops, Accessible Pedestrian Signal (APS) systems, shared use paths, accessible parking spaces, and other infrastructure types that promote accessibility for people with limited mobility. 62 Many of these guidelines are informed by ADA standards and include details such as the maximum level change allowed along a shared use path, the locations of pedestrian curb ramps and signal push buttons at crossings, and design elements of shelters at bus stops and train stations. Many of these guidelines are also informed by the US Access Board’s Public Right-of-Way Accessibility Guidelines, which includes additional technical requirements about pedestrian walking speed, curb ramp design, and more.63
The MPO can work to identify where in the region these guidelines are not being met, or in what ways the guidelines do not meet the needs of people with limited mobility. As a frequent partner of MassDOT, the MPO staff has the ability to collaborate with MassDOT staff to advance more accessibility features identified through this study in statewide design requirements.
For municipal and quick-build projects where the MPO hires and directly oversees consultants, the agency has meaningful design influence and should use it to raise accessibility standards proactively. Quick-build implementations sometimes fail to preserve the accessibility considerations of the original recommendation. Through coordination with bodies such as the Vision Zero Task Force and the Active Transportation Steering Committee, as well as direct coordination with people who have firsthand experience navigating with mobility limitations, the MPO can advocate for the principles identified in this study. These relationships allow external perspectives to inform technical recommendations, even when the MPO cannot mandate specific design outcomes.
Crash data analysis shows that older adults tend to be more vulnerable to fatal and severe injuries. Future safety work can focus on older adults as vulnerable road users. Snow and ice removal is a practical area where safety planning intersects with limited mobility concerns. Several municipalities already include sidewalk clearing priorities in their safety action plans. The MPO can do more to identify priority areas for snow and ice removal.
The MPO also produces numerous annual documents that focus on equity and accessibility of transportation. The Transportation Improvement Program (TIP) is a five-year rolling capital plan that details all the transportation projects that will receive federal funding in the Boston region. MPO staff score projects on a set of criteria to determine which ones should receive funding, based on the MPO’s key goal areas. Criteria related to all of the goals, but especially equity, safety, and access and connectivity, can be revisited and updated to include ideas gained through this study. The MPO also will continue to contribute data collection and analysis for annual Title VI reporting to the MBTA.
The MPO's own terminology also warrants attention. Terms like "walk, bike, and roll" aim to signal inclusivity, but "roll" is often read as referring to micromobility rather than wheelchair users specifically, whose infrastructure needs differ substantially from those of a cyclist or scooter rider. The MPO can be more precise about this distinction in its own materials.
In much of the MPO’s analysis work, the final results are in the form of singular values. For example, for destination access analyses, the results are framed as the number of destinations an average person can access by a given mode (biking, transit, etc.) in a certain time frame.
Instead of producing singular regional values, accounting for a variety of experiences should produce a range of values. For destination access analyses, the MPO employs the use of Conveyal, a platform used to model how people move throughout the region using a variety of modes, and records the number of destinations of a given type that can be reached with a given set of parameters. These parameters include the walking and biking speeds, the maximum level of traffic stress that is acceptable for a given route, and how many transfers are allowed for a transit trip. The number of transfers needed to complete a given trip was a point of particular concern for participants in the stakeholder interviews (see Section 2.5 and Section 3.4). Every additional transfer makes a transit trip more difficult, decreasing the likelihood that some people with limited mobility will make the trip in the first place. If the analysis varied these parameters to account for different perspectives, the results would represent a range of experiences, not just a single average.
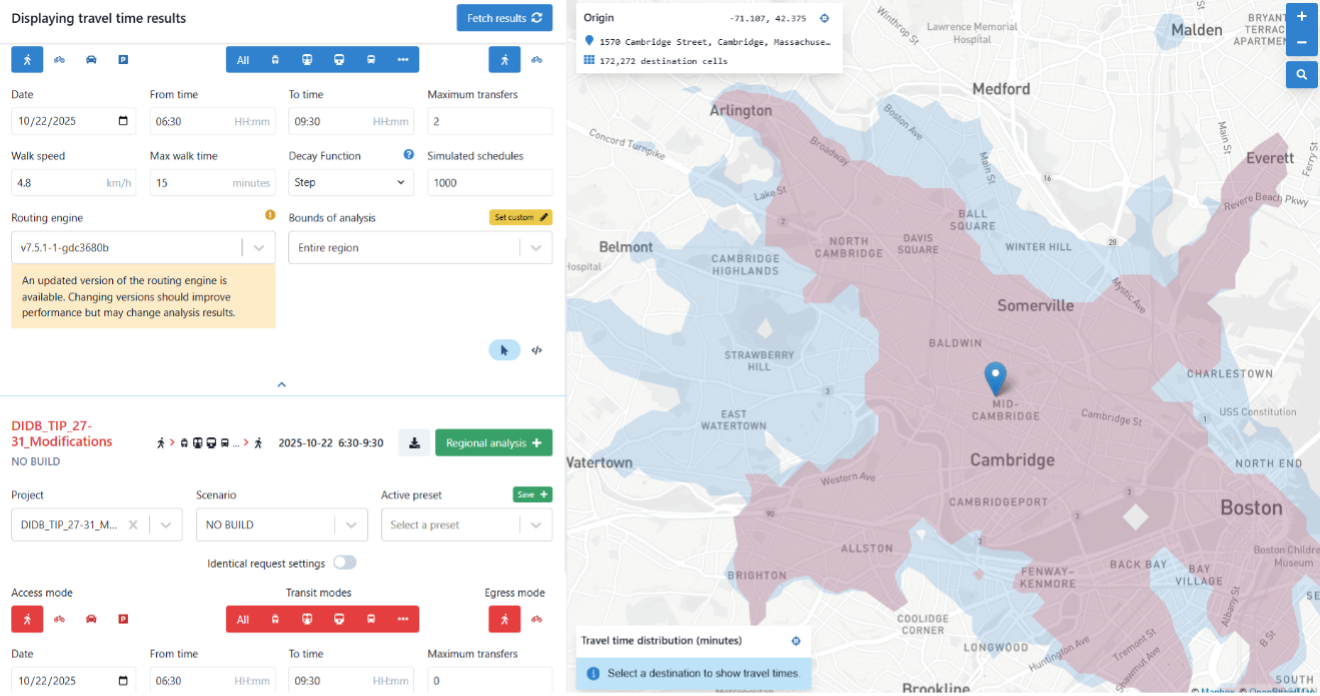
The image below in Figure 1 displays an example of how a change in these parameters can drastically impact the results of a destination access analysis in Conveyal. The two areas shown on the map represent the area a person can reach during a 45-minute transit trip originating from a single point in Cambridge. The difference in the two results comes from the “maximum transfers” parameter. The larger blue area shown in the map includes all trips that have a maximum of two transfers, which is what is typically used for destination access analysis, while the smaller purple area on the map (corresponding to the red highlighted information) only includes the trips that have zero transfers. If a person with limited mobility finds transfers difficult, then many important destinations can seem out of reach.
Figure 1
Conveyal Destination Access Results
Note: This figure shows Conveyal results for a 45-minute transit trip from a single origin point in Cambridge. The larger blue area on the map is the area that can be reached with a maximum of two transfers (the standard setting for the Boston Region MPO’s destination access analyses). The smaller purple area on the map (corresponding to the red highlighted information) can be reached with no transfers.
To create the routing network for transit trips, Conveyal employs GTFS schedule and stop information. It is currently unclear the extent to which, if at all, wheelchair accessibility of stations or the ease of transfer between stops is incorporated into the routing algorithm. More collaboration with Conveyal’s team is necessary to ensure that it is possible to incorporate this information into transit analysis.
Conveyal and GraphHopper both apply a constant default walking speed across all pedestrian segments. Both support custom speed profiles that vary by surface type or road class, though those profiles rarely reflect the movement of travelers with limited mobility. Where OpenStreetMap sidewalk data allow, segment-level adjustments could replace that constant. A narrow sidewalk shared with other pedestrians or a cracked or uneven surface would reduce the modeled speed of someone using a wheelchair or walker to reflect the increase in physical effort. Characteristics of the pedestrian environment including cross-slope or grade, curb cuts, tactile markings, elevation changes, lighting, and marked crosswalks can be used to modify the modeled speeds or to exclude inaccessible segments from potential routes (see Section 2.3). This level of detail likely would not be able to be achieved with OSM data alone and requires supplemental data sources or the use of a new tool.
In other analysis work, the MPO staff develops walksheds to see how many people can reach a transit stop on foot. These walksheds assume that everyone can use every sidewalk and crosswalk. The literature review and stakeholder interviews show that sidewalk and crosswalk infrastructure strongly shapes whether a route is usable for someone with limited mobility. Even if a transit stop itself is accessible, the surrounding sidewalk network can make that stop unreachable. A single inaccessible stop can derail an entire trip, so identifying which stops are problematic is crucial to understanding how people with limited mobility travel throughout the region. A walkshed built on able-bodied walking speed overstates the true accessibility reach of someone with limited mobility, masking gaps in service coverage that a more representative model would reveal.
The MPO's travel demand model presents a related opportunity. The model represents population in a fully disaggregated manner. This means that the population can be segmented by a wide range of personal characteristics and can be used to test different trip rates and mode choices. The MPO’s modeling team is working to analyze how characteristics such as not being able to travel alone or only being able to drive during the daytime can influence choices of travel purposes, destinations, and modes. The results can be used in tandem with tools that have different path characteristics to see where detours are most onerous or new accessible infrastructure is most beneficial.
Engaged stakeholders surfaced several priorities and possible solutions to accessibility problems that could be incorporated in projects the MPO supports. On the topic of infrastructure, participants repeatedly named benches with backs and armrests as a high-priority need, along with accessible bus shelters sized for wheelchairs, improved lighting, shade, better pedestrian signals, and improved announcement sound quality. On the topic of service, they pointed to microtransit (successful but uneven in coverage), extended service hours, transit hubs that reduce transfers, and cross-regional coordination as promising directions. The strategy sessions also fostered conversations about ideas for new areas of study that have not previously been explored by the MPO.
Stakeholders’ comments on crossing obstacles prompted analysts on the MPO’s staff to suggest potential analyses that would model how crosswalk infrastructure could impact a person’s trip. Signal timing might be too short for those who walk or roll in a wheelchair or mobility device at slower speeds, and the absence of flashing beacons or accessible pedestrian signals can make a crossing too uncomfortable for someone with limited mobility. Identifying these crossings and analyzing how a person’s trip might change if these crossings are deemed inaccessible could help prioritize areas for intervention.
When it comes to walking or rolling in wheelchairs or mobility devices on sidewalks, many barriers reported during the stakeholder interviews cannot be represented in a regional sidewalk dataset. Temporary conditions such as obstructions on the sidewalks, snowy or icy surfaces, as well as deteriorating features such as worn curb cuts and failed streetlights would not be reflected in a dataset that is not updated frequently. Strategy session participants suggested using 311 call data (see Section 3.2.4) to identify places with frequent issues and develop a supplemental resource that flags these areas.
The impact of heat on people with limited mobility is another avenue of study. Traveling on extremely hot days can be particularly dangerous for people with limited mobility, as they can have increased difficulty regulating their body temperature. If a walking or rolling trip takes longer than for someone without mobility limitations, they are also exposed to the heat for a longer period of time. Recently, the MPO developed the Universal Thermal Climate Index (UTCI) for the Boston region, providing high resolution data about the perceived thermal comfort that reflects how the human body experiences heat.64 To calculate this metric, environmental data were combined with assumptions about how people’s metabolism and clothing affect how they process heat. Supplemental analyses that update these assumptions to reflect a broader range of experiences could lead to a more robust understanding of how heat impacts older adults and people with disabilities.
People with limited mobility want to be able to reach the same types of destinations as anyone else. However, medical trips came up repeatedly as a particularly important destination for people with limited mobility and missed medical trips can have serious consequences (see Section 2.1). It is important to know when and where people are missing these trips so that additional support can be provided to those who need help making these trips. Unfortunately, trips that do not happen leave no data trace, which makes this a difficult but important gap to address. Public health records, hospital-reported missed appointment data, and canceled ride bookings could be mapped against transit deserts to identify where transportation gaps are causing people to miss care. Hospitals are required to report on transportation gaps periodically, making these records a potential starting point for identifying transportation-driven care gaps.
In interviews, stakeholders repeatedly raised the importance of reliable, familiar transit routes for many of those with mobility limitations, and noted how difficult a trip can become if a rider with a disability is forced to make additional transfers (see Section 2.5 and Section 3.4). MBTA service disruptions and replacement shuttling can contribute to both of these issues. Long periods of bus substitution and shuttling are becoming increasingly routine. Shuttles introduce unpredictability, add transfers to a trip, and create uncertainty about accessibility both as it relates to the shuttle vehicles themselves and the transfer to and from the service. Shuttle drivers are often navigating unfamiliar routes while also trying to accommodate riders with accessibility needs. A focused study on how shuttling affects people with limited mobility could be a valuable tool for advocating for improvements in the future.
Stakeholders repeatedly pointed to the need for further study into paratransit, microtransit, and rideshare services (see Section 2.5). In the strategy sessions, MPO planners and analysts discussed potential approaches to studying these services. The agency currently conducts very little analysis of paratransit. Qualitative feedback collected through prior work indicated serious service quality concerns, but data constraints limit what can be done analytically. Individual trip data from The RIDE is not available to protect the privacy of those that use the service. Aggregated or anonymized versions may be made available for specific questions with appropriate justification. The MBTA publishes non-spatial data about The RIDE, with daily summaries of the number of trips taken and the service’s reliability.65 A study could be conducted that analyzes regional variations in reliability and usage of the service related to changes in the transit system, time of day, week, or year, weather conditions, and more.
The conversations with stakeholders highlighted the many challenges people with limited mobility face when using a rideshare service. Drivers might cancel on them at the last minute if they are made aware of a person’s disability, service animals and mobility devices might not be allowed in rideshare vehicles, and drivers might not be able to help a rider to the door after exiting the vehicle. The MPO has access to trip-level data from transportation network companies (TNCs) in the Boston region. Unfortunately for the purposes of this work, it does not include any indication of a rider's mobility status or any discrimination they experienced. However, there are other ways to analyze how people with limited mobility interact with the rideshare system. For example, the lack of weekend and holiday service for municipal and other local paratransit services was identified as a significant barrier. TNC data could support an analysis of service coverage gaps on those days, framed around trip destinations commonly used by people with limited mobility (e.g., senior centers).
Microtransit was identified as a way to fill gaps in the transit system that could benefit all users, but particularly people with mobility limitations. Some municipalities provide microtransit services, but viability varies with per-trip costs rising when demand is too low and capacity strained when demand is too high. The MPO staff could work in coordination with MassDOT on a siting analysis to identify where service would best meet the needs of people who currently lack viable transportation alternatives.
Trip-related decisions are a topic of great interest to the MPO staff, especially for those who study mode choice. Interviews with stakeholders fostered ideas about further research to understand the mode choices made by people with limited mobility.
Stakeholder interviews raised concerns about how difficult it can be for those who are faced with surrendering their license because they can no longer drive independently (see Section 2.6). That loss of independence can feel isolating and create anxiety about how they will be able to get around. The MPO can help by studying and identifying which interventions at these key life moments can be most effective at incentivizing people to get involved with alternative modes of transportation, which would make the transition as smooth as possible.
The conversations also provided some anecdotal evidence that certain conditions, whether poor sidewalk quality, unsafe crosswalks, difficult transfers, or inaccessible transit vehicles, can impact the route someone with limited mobility takes or lead them to forgo their trip altogether. More research could identify the most frequent pain points in the regional transportation system that lead to certain mode choices over others, and the conditions that result in dropped trips.
Participants consistently cited unpredictable paratransit arrivals, out-of-service elevators, and uncleared snow as barriers, pointing to a need for accurate real-time feeds that go beyond what is currently available. The MPO could help identify these gaps and prioritize which to address first. Detecting an accessibility problem is only the first step. A smooth pipeline from detection to prioritization to maintenance referral, with the process tracked end to end, matters just as much. Accessibility issues can spike all at once especially during snow and rain storms when conditions can change quickly (see Section 2.7). So this pipeline needs to be responsive and fast to deploy. Tools that integrate real-time local service data would let riders know, for example, that an elevator is out of service before they reach that station. The same logic applies to snow clearance: a real-time way to track removal equipment, where snow has already been cleared, and when remaining areas are scheduled to open would directly address one of the most commonly cited barriers.
Table 1 below provides a summary of the key ideas that came out of this study to better incorporate perspectives of people with limited mobility into the data-driven work done at the MPO. These recommendations include shifts in how analysis results are framed and delivered, changes in existing methodologies and work products, and novel areas of study. MPO staff will explore these ideas while continuing to strategize about additional ways the knowledge gained from this study can be implemented into analysis work.
Table 1
Recommendations by Focus Area
Focus Area |
Challenge |
Analysis or Study |
Leaders |
Reporting metrics |
Analyses report one value for an average traveler based on assumptions made about typical travelers. |
Report a range instead of a single regional figure. |
MPO destination access analysts |
Destination access |
Every added transfer lowers the chance a trip happens. People have varying walking speeds and ability to use active transportation infrastructure.
|
Vary Conveyal walking speed, traffic stress, and transfer limits. Study relationship between origin-destination locations and one-seat rides to prioritize areas for intervention. |
MPO destination access analysts |
Paratransit and rideshare |
Booking runs days ahead and return pickups arrive unpredictably. Drivers cancel on riders with canes or service animals. Weekend and holiday service is limited. |
Analyze published reliability data from The RIDE in relation to weather, time, and disruptions. Use TNC data to map weekend coverage gaps. Site microtransit where alternatives are missing. Develop measures of paratransit access to define gaps in the system. |
MPO analysts, with the MBTA, MassDOT, and Councils on Aging |
Sidewalks and crossings |
Gaps, sunken curb cuts, brick, and street clutter block routes. Push buttons sit out of reach and signal timing runs short. |
Add segment-level speed penalties in Conveyal and GraphHopper for surface, width, and cross-slope. Rebuild walksheds on that network and flag problem segments with 311 data. |
MPO data analysts, with municipalities and developers of new mapping technologies |
Transit stations and vehicles |
An accessible designation for stations and vehicles does not ensure a rider can make the trip. Out of service elevators, fare gates, gaps in platforms, and crowding can prevent a rider from making a trip. |
Revisit the criteria used to designate a station accessible. |
MPO Title VI and NTD staff, with the MBTA |
Biking and adaptive cycling |
Racks, barriers, and turning radii exclude adaptive bikes. Floating stops and bike lanes conflict with RIDE drop-offs and visually impaired travelers. |
Study the accessibility of active modes. Map conflicts between bike facilities and accessible pick-up and drop-off zones. |
MPO active transportation staff |
Driving and parking |
Drivers and bike lanes block accessible spaces, curb height varies, and meters are hard to reach from a wheelchair. |
Factor disability into the travel demand model where data permits. Utilize local resources such as the Accessible Parking and Protected Bike Lanes dataset to identify areas for intervention. |
MPO travel demand modelers, Councils on Aging, and other advocacy groups |
Driving cessation |
Having to surrender one’s license can be a big life transition and can lead to feelings of isolation and loss of independence. |
Study which interventions at license surrender shift people to other modes. |
MPO planners and analysts with Councils on Aging |
Weather |
Snow fills curb cuts, buries tactile cues, and takes elevators out of service. Heat lengthens exposure and cancels trips. |
Identify priority areas for snow and ice removal. Rerun the regional UTCI with assumptions for older adults and wheelchair users. |
MPO planners and analysts, with the Vision Zero Task Force |
Medical trips and data gaps |
People sacrifice social trips to protect medical ones. Trips that never happen leave no data trace. |
Map missed appointments and canceled bookings in relation to transit deserts. Continue direct engagement to understand suppressed trips. |
MPO data analysts and communications and engagement team, with hospitals and public health agencies |
Cross-boundary travel |
A trip across two RTA service areas can take a full day. |
Study transfer reliability at service boundaries. |
MPO planners with RTAs, the MBTA, and municipalities |
Real-time information |
Riders may not have information as to whether an elevator is accessible or a sidewalk is clear. |
Prioritize real-time feeds at transit stations and on transit websites and applications and a tracked pipeline from detection to maintenance. |
MPO planners and data management team, and MBTA and RTA staff |
MPO process and influence |
The MPO often funds projects through the TIP. The MPO’s involvement in implementation is currently limited but will soon expand with grant-funded safe streets quick-build implementations. |
Revisit TIP scoring for equity, safety, and access. Develop standards for consultant-led projects and quick build implementations. Use precise terms in MPO materials. |
MPO TIP staff, safety staff, and project managers |
MassDOT = Massachusetts Department of Transportation. MBTA = Massachusetts Bay Transportation Authority. MPO = metropolitan planning organization. NTD = National Transit Database. TIP = Transportation Improvement Program. TNC = transportation network company. RTA = regional transit authority. UTCI = Universal Thermal Climate Index.
People in the Boston region experience a wide variety of mobility challenges with different levels of severity and impact on daily life. While this study sought perspectives from a wide range of people and populations, no single study can fully capture every experience. A single accessibility designation, whether in GTFS, OSM, or municipal inventories, cannot fully reflect the experience of all travelers.
A lack of data limits our ability to include the perspectives of people with limited mobility in our quantitative analysis. Where condition data exist at all, accessibility features are usually recorded as present or absent rather than rated for quality, so a curb ramp that is steep, cracked, or too narrow is indistinguishable in the record from one that is not. Even basic information on sidewalk quality, curb cuts, and crossing times is limited regionally. Bicycle and pedestrian counters may also undercount people using mobility devices, leading to an understatement of their demand for travel. Nevertheless, this study represents a step toward more thoughtful and representative analyses and planning processes at the Boston Region MPO.
While our engagement efforts reached a number of stakeholders, we recognize that there are others who were unable to participate. Most participants came through a Council on Aging, independent living center, disability commission, or advocacy organization. Those that are most isolated due to inaccessible transportation are unlikely to be part of these groups. The other literature and data sources reviewed in Sections 2 and 3 may share the same bias. In addition, we did not identify any direct measures of unmet demand or trip suppression, and missed or canceled paratransit trips are not tracked regionally. Direct engagement therefore remains the best available method to understand the trips not taken due to limited mobility. This gap matters for data-driven access analyses because the populations most constrained by inaccessible infrastructure are the least visible in standard travel data.
Finally, engagement describes experience, not frequency. Participants identified which barriers matter and why, but the engagement process alone cannot establish how often each barrier is present or where in the region people face these obstacles. The accounts we heard through our engagement efforts do not provide a complete picture of barriers in the region but provide direction for continued analysis.
This study has drawn on published research, stakeholder interviews, and internal strategy sessions to describe how people with limited mobility travel in the Boston region, where the system fails them, and what the MPO can do to close those gaps. People with limited mobility navigate a transportation system that was not always designed with their needs in mind. The gaps in infrastructure, data, service reliability, and analytical methods documented in this study are not incidental but structural.
The path forward requires changes at multiple levels: updating accessibility standards that blend designation with usability; building analytical tools that represent a range of travel experiences rather than a single average; filling data gaps that render the most constrained travelers invisible in standard sources; and strengthening coordination across municipal and regional service boundaries. None of these steps alone is sufficient, but together they represent a meaningful shift toward transportation planning that treats accessibility as a measurable outcome rather than a compliance threshold. The Boston Region MPO is committed to advancing that shift through the research directions, analysis improvements, and partnerships described in this report.
Civil Rights Notice to the Public
Welcome. Bem Vinda. Bienvenido. Akeyi. 欢迎. 歡迎
You are invited to participate in our transportation planning process, free from discrimination. The Boston Region Metropolitan Planning Organization (MPO) is committed to nondiscrimination in all activities and complies with Title VI of the Civil Rights Act of 1964, which prohibits discrimination on the basis of race, color, or national origin (including limited English proficiency). Related federal and state nondiscrimination laws prohibit discrimination on the basis of age, sex, disability, and additional protected characteristics.
For additional information or to file a civil rights complaint, visit www.bostonmpo.org/mpo_non_discrimination.
To request this information in a different language or format, please contact:
Boston Region MPO Title VI Specialist
10 Park Plaza, Suite 6260
Boston, MA 02116
Phone: 857.702.3700
Email: civilrights@bostonmpo.org
For people with hearing or speaking difficulties, connect through the state MassRelay service, www.mass.gov/massrelay. Please allow at least five business days for your request to be fulfilled.
1 This number does not include individuals living in nursing homes or other group quarters.
United States Department of Transportation, Bureau of Transportation Statistics. 2024. Travel Patterns of Adults With Travel-Limiting Disabilities. Washington, D.C. https://www.bts.gov/travel-patterns-with-disabilities
2 Boston Region Metropolitan Planning Organization (website), Community Transportation Access Program, accessed September 9, 2026. https://www.ctps.org/community-transportation-access
3 Boston Region Metropolitan Planning Organization, 2023 Coordinated Public Transit-Human Services Transportation Plan. https://www.ctps.org/data/pdf/plans/CHST/2023-CPTHST-with-Appendix.pdf
4 Boston Region Metropolitan Planning Organization, The Community Transportation Dashboard (website), accessed September 17, 2026. https://ctps.shinyapps.io/community_transportation
5 Mindell, Jennifer S., Sewa Amin, Roger L. Mackett, John Taylor, and Steve Yaffe. 2024. “Disability and Travel.” In Advances in Transport Policy and Planning, vol. 13. pp. 47-87 Academic Press. doi.org/10.1016/bs.atpp.2023.11.009
6 United States Department of Transportation, Bureau of Transportation Statistics. 2024. Travel Patterns of Adults With Travel-Limiting Disabilities. Washington, D.C. https://www.bts.gov/travel-patterns-with-disabilities
7 Mindell, Jennifer S., Sewa Amin, Roger L. Mackett, John Taylor, and Steve Yaffe. 2024. “Disability and Travel.” In Advances in Transport Policy and Planning, vol. 13. pp. 47-87 Academic Press. doi.org/10.1016/bs.atpp.2023.11.009
8 United States Department of Transportation, Bureau of Transportation Statistics. 2024. Travel Patterns of Adults With Travel-Limiting Disabilities. Washington, D.C. https://www.bts.gov/travel-patterns-with-disabilities
9 ITDP and TUMI. 2025. From Challenges to Solutions: Building Inclusive Transport for People with Disabilities. https://itdp.org/publication/building-inclusive-transport-for-people-with-disabilities/
10 Mindell, Jennifer S., Sewa Amin, Roger L. Mackett, John Taylor, and Steve Yaffe. 2024. “Disability and Travel.” In Advances in Transport Policy and Planning, vol. 13. pp. 47-87 Academic Press. doi.org/10.1016/bs.atpp.2023.11.009
11 Kirchner, Corinne E., Elaine G. Gerber, and Brooke C. Smith. 2008. “Designed to Deter. Community Barriers to Physical Activity for People with Visual or Motor Impairments.” American Journal of Preventive Medicine 34 (4): 349–52. doi.org/10.1016/j.amepre.2008.01.005
12 Health and Care Research Wales Evidence Centre. 2025. The Impact of Changes in Active Travel on Disabled People: A Rapid Review. https://orca.cardiff.ac.uk/id/eprint/184086/
13 Health and Care Research Wales Evidence Centre. 2025. The Impact of Changes in Active Travel on Disabled People: A Rapid Review. https://orca.cardiff.ac.uk/id/eprint/184086/
14 Park, Keunhyun, Hossein Nasr Esfahani, Valerie Long Novack, et al. 2023. “Impacts of Disability on Daily Travel Behaviour: A Systematic Review.” Transport Reviews 43 (2): 178–203. doi.org/10.1080/01441647.2022.2060371
15 Lee, Kyuhyun, and Ipek Nese Sener. 2023. “E-Bikes Toward Inclusive Mobility: A Literature Review of Perceptions, Concerns, and Barriers.” Transportation Research Interdisciplinary Perspectives 22 (November): 100940. doi.org/10.1016/j.trip.2023.100940
16 Ferrari, Laura, Michele Berlingerio, Francesco Calabrese, and Jon Reades. 2014. “Improving the Accessibility of Urban Transportation Networks for People with Disabilities.” Transportation Research Part C: Emerging Technologies 45: 27–40. doi.org/10.1016/j.trc.2013.10.005
17 Davidson, Joshua H., Ilil Feiglin, and Megan S. Ryerson. 2023 “A One-Seat Ride Coverage Ratio Using Administrative Origin Destination Data.” Findings. https://doi.org/10.32866/001c.57771.
18 Health and Care Research Wales Evidence Centre. 2025. The Impact of Changes in Active Travel on Disabled People: A Rapid Review. https://orca.cardiff.ac.uk/id/eprint/184086/
19 Rosa, Manuela Pires, Homayoun Golestaneh, Germana Santiago de Mello, et al. 2025. “Co-Designing an Inclusive Bus Stop for a Tourist Transportation Hub.” CoDesign 21 (3): 447–67. doi.org/10.1080/15710882.2024.2446557
20 Shen, Xiaoming, Siqi Zheng, Rui Wang, et al. 2023. “Disabled Travel and Urban Environment: A Literature Review.” Transportation Research Part D: Transport and Environment 115: 103589. doi.org/10.1016/j.trd.2022.103589
21 Mindell, Jennifer S., Sewa Amin, Roger L. Mackett, John Taylor, and Steve Yaffe. 2024. “Disability and Travel.” In Advances in Transport Policy and Planning, vol. 13. pp. 47-87 Academic Press. doi.org/10.1016/bs.atpp.2023.11.009
22 Massachusetts Department of Transportation. 2026. “Environmental Scan of Community Transit Needs in Massachusetts: Final Report.” https://www.mass.gov/doc/environmental-scan-of-community-transit-needs-in-massachusetts-final-report/download
23 Metropolitan Planning Council. 2019. “Toward Universal Mobility Technical Appendix.” Chicago: Metropolitan Planning Council. https://metroplanning.org/wp-content/uploads/2023/10/toward_universal_mobility_technical_appendix.pdf.
24 Park, Keunhyun, Hossein Nasr Esfahani, Valerie Long Novack, et al. 2023. “Impacts of Disability on Daily Travel Behaviour: A Systematic Review.” Transport Reviews 43 (2): 178–203. doi.org/10.1080/01441647.2022.2060371
25 Massachusetts Department of Transportation. 2026. “Environmental Scan of Community Transit Needs in Massachusetts: Final Report.” https://www.mass.gov/doc/environmental-scan-of-community-transit-needs-in-massachusetts-final-report/download
26 Liddle, Jacki, Theresa L. Scott, Melanie Hoyle, Amanda Salmon, Louise Gustafsson, and Nancy A. Pachana. 2024. “The Mental Health Outcomes of Driving Cessation for Older People: A Systematic Review.” International Psychogeriatrics, December 4, 100020. doi.org/10.1016/j.inpsyc.2024.100020
27 Dickerson, Anne E., Tadhg Stapleton, Jamie Bloss, et al. 2024. “A Systematic Review of Effective Interventions and Strategies to Support the Transition of Older Adults From Driving to Driving Retirement/Cessation.” Innovation in Aging 8 (6): igae054. doi.org/10.1093/geroni/igae054
28 Borisoff, Jaimie F., Jacquie Ripat, and Franco Chan. 2018. “Seasonal Patterns of Community Participation and Mobility of Wheelchair Users Over an Entire Year.” Archives of Physical Medicine and Rehabilitation 99 (8): 1553–60. doi.org/10.1016/j.apmr.2018.02.011
29 Fan, Huiying, Hongyu Lu, Geyu Lyu, Angshuman Guin, and Randall Guensler. 2024. “A Framework for Assessing Cumulative Exposure to Extreme Temperatures During Transit Trip.” arXiv:2408.04081. Preprint, August 7. doi.org/10.48550/arXiv.2408.04081
30 Federal Highway Administration. 2022. “2022 NextGen National Household Travel Survey Core Data.” U.S. Department of Transportation. http://nhts.ornl.gov.
31 National Household Travel Survey, Codebook, accessed September 17, 2026. https://nhts.ornl.gov/media/2022/doc/codebook.pdf
32 2010 Massachusetts Household Travel Survey (MassDOT, 2012), accessed September 9, 2026. https://www.mass.gov/doc/2010-massachusetts-household-travel-survey
33 Massachusetts Bay Transportation Authority (website), Fares Overview, accessed September 17, 2026. https://www.mbta.com/fares/reduced/transportation-access-pass
34 Massachusetts Bay Transportation Authority, Office of Performance Management and Innovation, MBTA The RIDE Ridership and Reliability, Massachusetts geoDOT, published June 10, 2026, accessed September 9, 2026. https://mbta-massdot.opendata.arcgis.com/datasets/342b303ca63843028897b04734d0b203/about
35 Massachusetts Bay Transportation Authority (website), Performance Metrics, accessed September 17, 2026. https://www.mbta.com/performance-metrics/the-rider-census
36 Massachusetts Bay Transportation Authority (website), Developers, accessed September 17, 2026. https://www.mbta.com/developers/gtfs
37 Massachusetts Department of Transportation (website), Transit data for developers, accessed September 17, 2026, https://www.mass.gov/lists/mbta-and-transit-data-for-developers#massachusetts-regional-transit-authorities-
38 Massachusetts Bay Transportation Authority (website), MBTA LAMP Public Data, accessed September 9, 2026. https://performancedata.mbta.com/
39 Massachusetts Bay Transportation Authority, Office of Performance Management and Innovation, 2017 PATI audit, Massachusetts geoDOT, published August 10, 2022, accessed September 17, 2026. https://mbta-massdot.opendata.arcgis.com/datasets/MassDOT::pati-bus-stops/about
40 General Transit Feed Specification (website), accessed September 17, 2026. https://gtfs.org/documentation/schedule/schedule-best-practices/#transferstxt
41 Massachusetts Department of Transportation, Pedestrian Curb Cuts, MassGIS Data Hub, accessed September 17, 2026. https://gis.data.mass.gov/datasets/MassDOT::pedestrian-curb-cuts
42 Massachusetts geoDOT, Pedestrian Facilities accessed September 17, 2026. https://geodot-massdot.hub.arcgis.com/datasets/pedestrian-facilities-1/
43 Massachusetts Department of Transportation, Crosswalks, MassGIS Data Hub, accessed September 9, 2026. https://gis.data.mass.gov/datasets/MassDOT::crosswalks
44 Massachusetts Department of Transportation, Crosswalks, MassGIS Data Hub, accessed September 9, 2026. https://gis.data.mass.gov/datasets/MassDOT::crosswalks
45 City of Cambridge (MA), Geographic Information System (website), accessed September 17, 2026. https://www.cambridgema.gov/gis/gisdatadictionary/basemap/basemap_sidewalks
46 City of Boston (website), 311 Service Requests, accessed September 17, 2026. https://data.boston.gov/dataset/311-service-requests
47 Downtown Boston Neighborhood Association (website), accessed September 17, 2026. https://bosdowntown.org/streets-sidewalks
48 WalkBoston (website), accessed September 17, 2026. https://dev.walkboston.org/
49 Transportation for Massachusetts (website), Shared Spaces, accessed September 9, 2026. https://t4ma.org/strengthening-coalition-power/shared-spaces/
50 Saha, Manaswi, Michael Saugstad, Hanuma Teja Maddali, et al. 2019. “Project Sidewalk: A Web-Based Crowdsourcing Tool for Collecting Sidewalk Accessibility Data At Scale.” Proceedings of the 2019 CHI Conference on Human Factors in Computing Systems (New York, NY, USA), CHI ’19, May 2, 1–14. doi.org/10.1145/3290605.3300292
51 Jon E. Froehlich, "McDevitt Middle School Earns State Recognition for Urban Accessibility Effort with Project Sidewalk," Makeability Lab, University of Washington, July 1, 2026. https://makeabilitylab.cs.washington.edu/news/mcdevitt-middle-school-earns-state-recognition-for-urban-accessibility-effort-with-project-sidewalk/
52 Makeability Lab, University of Washington (website), Project Sidewalk: Waltham, accessed September 9, 2026. https://sidewalk-waltham.cs.washington.edu/
53 Du, Hang, Shuaizhou Wang, Linlin Zhang, Mark Amo-Boateng, and Yaw Adu-Gyamfi. 2025. “Evaluating Neural Radiance Fields for ADA-Compliant Sidewalk Assessments: A Comparative Study with LiDAR and Manual Methods.” Infrastructures 10 (8): 191. doi.org/10.3390/infrastructures10080191
54 Liu, Xinlei, Kevin Wu, Minchu Kulkarni, et al. 2024. “Towards Fine-Grained Sidewalk Accessibility Assessment with Deep Learning: Initial Benchmarks and an Open Dataset.” Proceedings of the 26th International ACM SIGACCESS Conference on Computers and Accessibility (New York, NY, USA), ASSETS ’24, October 27, 1–12. doi.org/10.1145/3663548.3688531
55 Yang, Lihe, Bingyi Kang, Zilong Huang, et al. 2024. “Depth Anything V2.” Advances in Neural Information Processing Systems 37: 21875–911. doi.org/10.52202/079017-0688
56 Lee, Gaang, Byungjoo Choi, Houtan Jebelli, Changbum Ryan Ahn, and SangHyun Lee. 2020. “Wearable Biosensor and Collective Sensing–Based Approach for Detecting Older Adults’ Environmental Barriers.” Journal of Computing in Civil Engineering 34 (2): 04020002. doi.org/10.1061/(ASCE)CP.1943-5487.0000879
57 Darko, Justice, Larkin Folsom, Nigel Pugh, et al. 2022. “Adaptive Personalized Routing for Vulnerable Road Users.” IET Intelligent Transport Systems 16 (8): 1011–25. doi.org/10.1049/itr2.12191
58 The City of Amsterdam's AI Team, Accessible Route Planning (github repository, accessed September 17, 2026. https://github.com/Amsterdam-AI-Team/Accessible_Route_Planning
59 The Taskar Center for Accessible Technology (website), accessed September 17, 2026. https://tcat.cs.washington.edu/opensidewalks/
60 Massachusetts Bay Transportation Authority (website), Trip Planner, accessed September 17, 2026. https://www.mbta.com/trip-planner
61 Massachusetts Bay Transportation Authority (website), Stops, accessed September 17, 2026. https://www.mbta.com/stops/place-cntsq
62 Massachusetts Department of Transportation, Project Development and Design Guide (MassDOT, 2023), accessed September 9, 2026. https://www.mass.gov/manual/massdot-project-development-and-design-guide
63 US Access Board (website), R3: Technical Requirements, Public Right-of-Way Accessibility Guidelines, accessed September 9, 2026. https://www.access-board.gov/prowag/technical.html
64 Boston Region Metropolitan Planning Organization (website), NO-HEAT Project, accessed September 9, 2026. https://www.ctps.org/no-heat
65 Massachusetts Bay Transportation Authority, Office of Performance Management and Innovation, MBTA The RIDE Ridership and Reliability, Massachusetts geoDOT, published June 10, 2026, accessed September 9, 2026. https://mbta-massdot.opendata.arcgis.com/datasets/342b303ca63843028897b04734d0b203/about