Technical Memorandum
DATE: December 6, 2018
TO: Peter Lombardi, Town of Wenham
FROM: Benjamin Erban and Chen-Yuan Wang, MPO Staff
RE: Route 1A at Cherry Street, Monument Street, and Arbor Street in Wenham
This memorandum summarizes the analyses and improvement strategies for the downtown corridor of Wenham, where Route 1A (Main Street) intersects with Cherry Street, Monument Street, and Arbor Street. The document contains the following sections:
2. Existing Facilities and Land Uses
4. Existing Traffic Conditions
6. Existing Operations Analysis
7. Short-Term Improvement Alternatives
8. Long-Term Improvement Alternatives
It also includes technical appendices that contain data and methods applied in the study.
The purpose of the Safety and Operations Analyses at Selected Intersections study is to examine safety, operations, and mobility issues at major intersections in the Boston Region Metropolitan Planning Organization (MPO) region’s arterial highways—areas where many crashes occur, that experience congestion during peak traffic periods, or are in need of improvements to accommodate heavy vehicles (buses and trucks) or nonmotorized transportation (bicyclists and pedestrians). For the past 10 years, the MPO has conducted these planning studies, which have been well received by the municipalities in the region. These studies give communities an opportunity to look at the needs of the selected locations, starting at the conceptual level, before they commit funds for design and engineering. Eventually, if the project qualifies for federal funds, the study’s documentation also is useful to the Massachusetts Department of Transportation (MassDOT). These studies support the MPO’s visions and goals, which include increasing transportation safety, maintaining the transportation system, advancing mobility, and reducing congestion.
Following a selection process based on safety conditions, congested conditions, multimodal significance, regional significance, regional equity, and implementation potential, the following two locations from a short list of 10 intersections were approved for study by the MPO.1,2, 3,4,5,6,7
MPO staff discussed the safety and operations issues at the intersection and the scope of work for the study with the Town of Wenham, which expressed interest and willingness to participate in the study. An advisory task force—composed of representatives from the Town of Wenham and MassDOT—was established to guide this study. MPO staff met with the task force twice. The first meeting focused on the work scope and existing problems. In the second meeting, MPO staff presented the existing conditions, analyses, proposed improvements, and received advice from the task force members. This report reflects the task force’s feedback. Appendix A includes a list of task force members, information about the selection process, and comments about the study.
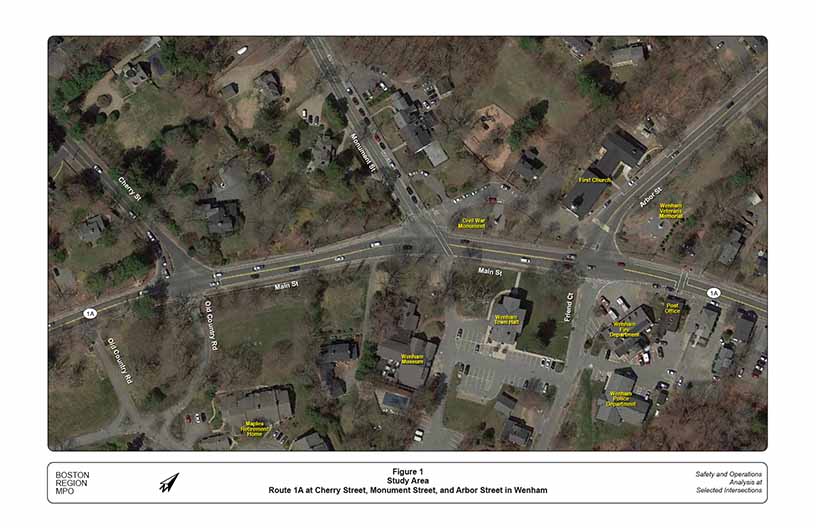
The study area (shown in Figure 1) is located in the center of the Town of Wenham and covers a quarter-mile segment of Route 1A. Route 1A intersects three streets within this distance: Cherry Street and Monument Street, which approach from the west and end at T intersections, and Arbor Street, which approaches from the north and forms a four-way intersection with the much smaller Friend Court. All three of these intersections are unsignalized.
Route 1A is classified as an urban principal arterial, Friend Court is classified as a local street, and Cherry Street, Monument Street, and Arbor Street are all minor arterials. MassDOT has jurisdiction over Route 1A and the Town has jurisdiction over all other roadways. All road segments are single-lane except at the end of Arbor Street, where there is a marked turn bay for southbound traffic. The right-of-way varies from 50 feet to 55 feet within the study area. Sidewalks are present on all streets besides Friend Court but are on only one side of the road in many places. Ten-foot shoulders are present along much of Route 1A. Although not allowed, vehicles sometimes park in the shoulders, especially near the church and post office.
The study corridor is part of the Wenham historic downtown and is adjacent to the Wenham Town Hall, Wenham Museum, and the First Church in Wenham. It is also home to several town services including the fire department, police station, and post office. There are some small businesses on Route 1A just north of the corridor as well as a teahouse off Monument Street. The property by the teahouse also hosts a day camp during summer months. Near the south end of the corridor across from Cherry Street is Maples, a retirement community.
There are several recreational attractions within one mile of the corridor, including the Wenham Country Club, Wenham Lake, Patton Park, and the Ipswich River Wildlife Sanctuary. The site is two miles (four minutes) from Route 128 and four miles (nine minutes) from Interstate 95 and Route 1. There is no local bus service, but the Newburyport/Rockport Line of the commuter rail has a stop two-thirds of a mile to the north (Hamilton/Wenham) and another stop one and one-half miles to the south (North Beverly).
Figure 1
Study Area
The Safety and Operations Analyses program examines safety, operational, and mobility concerns at major intersections within the Boston MPO. Each of these issues plays a role at the study location in Wenham.
The existing intersection geometry in the study area leads to several safety issues:
Many of these issues can be addressed by upgrading the existing infrastructure, which would improve safety for local users and through traffic alike.
Congestion is frequently observed during peak periods in the study area. At this location, the north-south Route 1A corridor intersects two other important traffic flows: Cherry Street, which carries traffic east-west to Danvers and Interstate 95, and Arbor Street, which extends north to Topsfield and several state parks. Monument Street branches from Cherry Street one-half mile from the study area and the east-west traffic flow is split between the Monument Street and Cherry Street intersections.
All three of the intersections in the study area are unsignalized, and consequently the side street approaches experience queueing and delay. Signalization at one or several of the intersections would have the potential to improve access from the side streets. Using multiple coordinated signals could further improve operations for all users by better managing the conflicting traffic flows through the tightly spaced intersections.
This segment of Route 1A is nominally the center of Wenham and is adjacent to several attractors of foot traffic including the town hall, the Wenham Museum, a church, a retirement community, a post office, and several businesses. However, inadequate pedestrian amenities means pedestrian access to these sites is more difficult than it should be. The Town of Wenham is interested in improving the sidewalks and crossings at the study location to better fulfil its role as a historic downtown area.
The Route 1A corridor is also a popular recreational cyclist route, with groups meeting on weekends in the fire station driveway before setting out for rides. There are currently no bicycle amenities in the study area apart from a variable-width paved shoulder, and addressing these needs should be part of any design proposal.
The corridor is also adjacent to the Wenham Police Department and Wenham Fire Department, the latter of which has its driveway opening directly onto the intersection at Arbor Street. The Town of Wenham has expressed interest in improving the ability of emergency vehicles to travel safely and quickly through the study corridor.
MassDOT Highway Division’s Traffic Data Collection section conducted automatic traffic recorder (ATR) counts over a three-day period from Monday November 27, 2017, to Thursday November 30, 2017. The counts collect traffic volumes, speeds, and classifications continuously over the collection period, and are used to determine the average weekday traffic (AWDT) of a roadway. Speed, volume, and classification counts were performed at five locations within the study area, and an additional four stations were set up to collect traffic volumes only.
The counts found the average daily traffic to be 15,000 to 20,000 vehicles per day on Route 1A (Main Street), 4,500 vehicles per day on Cherry Street, 3,800 vehicles per day on Monument Street, and 6,500 vehicles per day on Arbor Street. Heavy vehicle traffic was 1.9 percent of total traffic on Route 1A and 1.8 percent of total traffic on the side streets. More information on the volume and classification data can be found in Appendix B.
Travel speeds were also recorded and compared with speed regulations. The observed 85th-percentile speeds and posted speed limits within the study area are shown in Figure 2. The counts showed 85th-percentile speeds ranged from 35 miles per hour (mph) to 38 mph within the study area. Those speeds exceed the speed limits of 25 mph on Cherry Street and 30 mph elsewhere. The details of the speed calculations are also included in Appendix B.
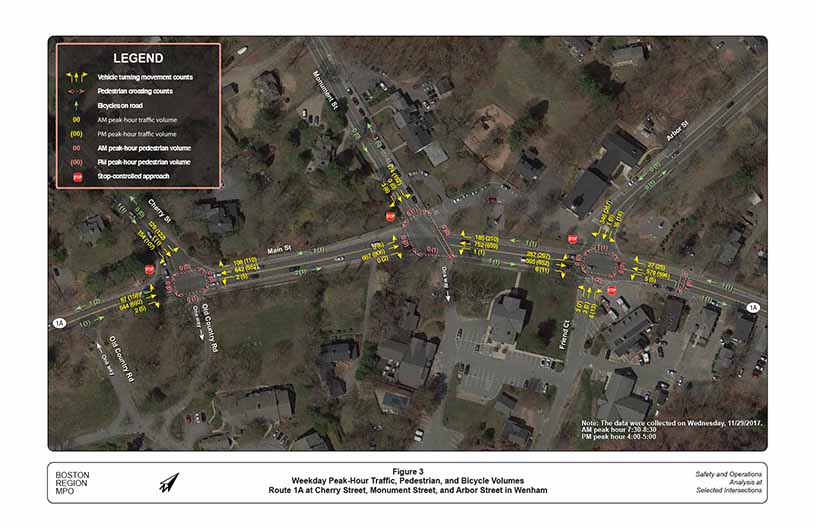
MassDOT Highway Division's Traffic Data Collection Section also collected turning-movement counts (TMC) in the study area on Wednesday November 29, 2017. The counts were conducted during the weekday AM peak travel period (7:00 AM–9:00 AM) and weekday PM peak travel period (4:00 PM–6:00 PM). The counts were conducted at each of the three intersections in the study area. Heavy vehicles such as school buses, transit buses, and trucks were counted separately. Pedestrian and bicycle counts were conducted simultaneously with the TMCs.
Figure 3 shows the peak hour turning movement, pedestrian, and bicycle volumes in the study area. The peak hours were 7:30 AM–8:30 AM for the morning peak and 4:00 PM–5:00 PM for the evening peak. There were only 17 total pedestrian crossing events observed during the four-hour observation interval, although pedestrian traffic would be expected to be higher during warmer months.
Figure 2
Speed Regulations and Estimated 85th Percentile Speeds
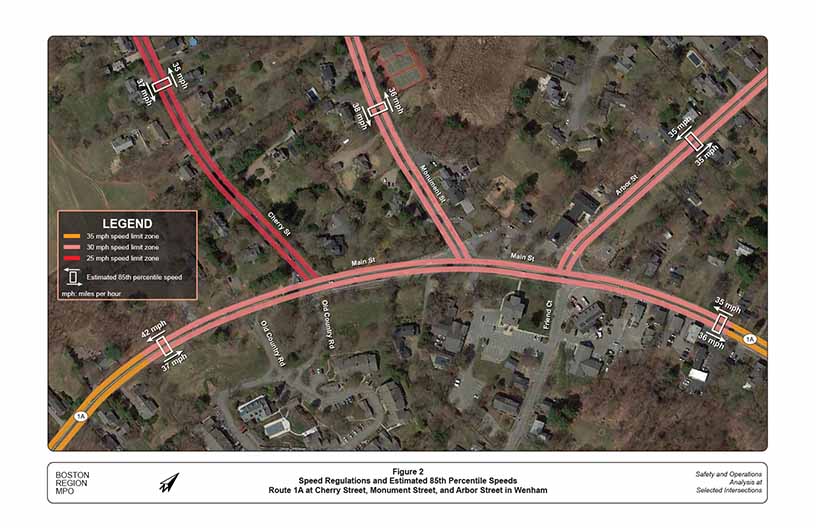
Figure 3
Weekday Peak-Hour Traffic, Pedestrian, and Bicycle Volumes
Ninety-two crashes were recorded by the Wenham Police Department over the seven-year period between 2011 and 2017. Table 1 separates these crashes by location and further breaks them down according to type of collision, severity, and factors that may have influenced the crash.
Table 1
2011–17 Crash Summary and Crash Rates
| Intersection, |
Arbor |
Monument Street |
Cherry Street |
Entire Corridor |
|---|---|---|---|---|
Crash Severity |
– |
– |
– |
– |
Non-fatal injury |
6 |
6 |
5 |
17 |
Property damage only |
21 |
23 |
28 |
72 |
0 |
1 |
2 |
3 |
|
Manner of Collision |
– |
– |
– |
– |
Angle |
8 |
13 |
18 |
39 |
Head-on |
1 |
0 |
0 |
1 |
Rear-end |
10 |
9 |
9 |
28 |
Sideswipe, opposite direction |
0 |
5 |
2 |
7 |
Sideswipe, same direction |
5 |
0 |
1 |
6 |
Single vehicle crash |
2 |
3 |
5 |
10 |
Unknown |
1 |
0 |
0 |
1 |
Road Surface Conditions |
– |
– |
– |
– |
Dry |
20 |
20 |
27 |
67 |
Snow/Ice |
0 |
2 |
2 |
4 |
Wet |
7 |
8 |
6 |
21 |
Ambient Light Conditions |
– |
– |
– |
– |
Dark - lighted roadway |
3 |
4 |
4 |
11 |
Daylight |
24 |
25 |
31 |
80 |
Other |
0 |
1 |
0 |
1 |
Weather Conditions |
– |
– |
– |
– |
Clear |
20 |
17 |
28 |
65 |
Cloudy |
3 |
5 |
2 |
10 |
Rain |
4 |
5 |
3 |
12 |
Snow |
0 |
3 |
2 |
5 |
Bicyclist/Pedestrian Involved |
– |
– |
– |
– |
Bicyclist |
0 |
1 |
1 |
2 |
Pedestrian |
0 |
0 |
0 |
0 |
Time Perioda |
– |
– |
– |
– |
Peak period |
15 |
17 |
19 |
51 |
Off-peak period |
12 |
13 |
16 |
41 |
Total Crashes |
27 |
30 |
35 |
92 |
Seven-year average (rounded) |
4 |
4 |
5 |
13 |
Crash rate (calculated) |
0.44b |
0.58 |
0.72 |
9.45c |
Crash rate (MassDOT District 4) |
0.57 |
0.57 |
0.57 |
3.49 |
a AM peak period = 7:00 AM–10:00 AM, PM peak period = 3:00 PM–6:00 PM
b Crash rates for individual intersections use intersection crash rate, with units crashes per year per million entering vehicles
c Crash rate for entire corridor uses corridor crash rate calculation, with units crashes per mile per year per million entering vehicles
Table 1 also compares the crash rates for both the individual intersections and the entire study corridor against average values. The crash rates for the three intersections give the number of crashes per year per million vehicles entering the intersection, and are compared against the 2016 District 4 average value for unsignalized intersections. The crash rate for the entire corridor gives the number of crashes per mile per year per million vehicles passing through the corridor, and is compared against the statewide average for all roadways with the same functional classification as Route 1A (Principal Arterial—Other). Worksheets detailing the crash-rate calculations can be found in Appendix C.
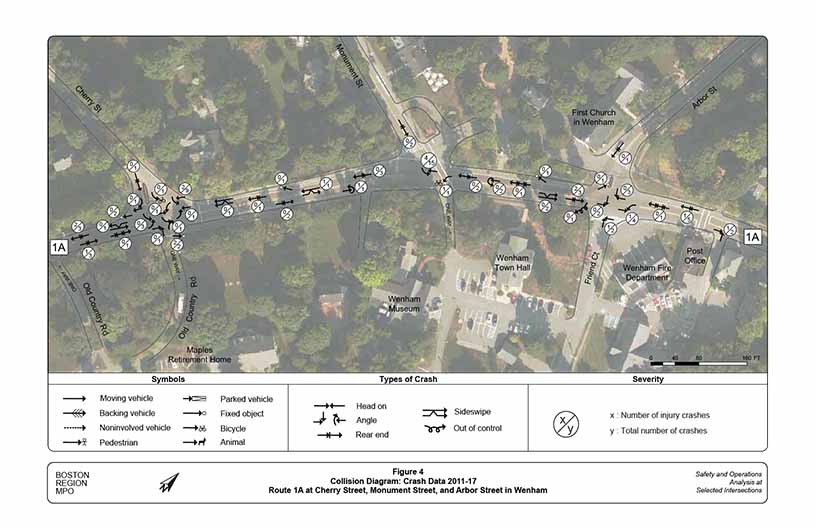
MPO staff also prepared a collision diagram for the study intersection to examine crash patterns. Police reports from the Wenham Police Department were obtained for the years 2011–17. Figure 4 shows the collision diagram. A second diagram containing index numbers that can be used to cross reference individual crash records is given in Appendix C.
The collision statistics and diagram show that turns are a safety issue at the unsignalized intersections within the corridor. Thirty-nine of the 92 collisions (42%) were angle crashes, and the collision diagram shows that most of these occurred when a vehicle turning left failed to yield to oncoming traffic. The single most dangerous maneuver was the left turn out of Monument Street, where 15 collisions occurred over the seven-year period. The turning distance from the marked stop line is nearly 100 feet, meaning drivers need a very long gap to execute the turn safely. During congested hours those gaps are scarce and impatient drivers may try to edge into traffic or cut across an oncoming vehicle.
The crash rate analysis showed that the Cherry Street intersection exceeded the District 4 average crash rate, while the Monument Street intersection was about equal to the district average crash rate. However, analyzing the study area as a corridor yields a corridor crash rate almost three times the statewide average for similar roadways (9.45 crashes per mile per year per million entering vehicles, compared to 3.49 crashes per mile per year per million entering vehicles). This result demonstrates that while these intersections might not represent a significant safety risk if they were on an isolated portion of Route 1A, when clustered within one-quarter mile of each other the frequency of collisions becomes a concern.
Figure 4
Collision Diagram: Crash Data 2011–17
Using the data and information collected, MPO staff built a traffic analysis network (with Synchro)8 for the AM and PM peak periods to assess the capacity and quality of traffic flow at the intersections. Staff conducted the analyses consistent with Highway Capacity Manual (HCM) methodologies.9 The HCM methodology demonstrates the driving conditions at signalized and unsignalized intersections in terms of levels of service (LOS) ratings A through F. LOS A represents the best operating conditions (little to no delay), while LOS F represents the worst operating conditions (very long delay). LOS E represents operating conditions at capacity (limit of acceptable delay). Table 2 shows the control delays associated with each LOS for signalized and unsignalized intersections.
Table 2
Existing Conditions Levels of Service and Control Delays at Intersections
Level of Service |
Signalized Intersections Control Delay (seconds per vehicle) |
Unsignalized Intersections Control Delay (seconds per vehicle) |
A |
≤ 10 |
≤ 10 |
B |
> 10–20 |
> 10–15 |
C |
> 20–35 |
> 15–25 |
D |
> 35–55 |
> 25–35 |
E |
> 55–80 |
> 35–50 |
F |
> 80 |
> 50 |
Table 3 presents peak-hour performance in terms of LOS, delay (average delay, seconds per vehicle), and queues (95th percentile queue length, feet) for existing conditions. The results show that vehicles face delays of more than three minutes on all side street approaches, which is well above the acceptable limit. More detail on the analyses can be found in Appendix D.
Table 3
Existing Peak Hour Levels of Service
Intersection |
– |
AM LOS |
AM Delay |
AM Queue |
PM LOS |
PM Delay |
PM Queue |
1A at Arbor Street |
– |
– |
– |
– |
– |
– |
– |
Route 1A Northbound |
L |
A |
8.4 |
44 |
A |
8.5 |
42 |
Route 1A Northbound |
TR |
A |
8.4 |
44 |
A |
8.5 |
42 |
Route 1A Southbound |
L |
A |
0.5 |
1 |
A |
0.2 |
1 |
Route 1A Southbound |
TR |
A |
0.5 |
1 |
A |
0.2 |
1 |
Arbor Street |
LT |
F |
>180 |
586 |
F |
>180 |
561 |
Arbor Street |
R |
F |
>180 |
586 |
F |
>180 |
561 |
Friend Court |
LTR |
F |
>180 |
95 |
F |
>180 |
125 |
Intersection Total |
– |
F |
65.8 |
– |
F |
74.1 |
– |
1A at Monument Street |
– |
– |
– |
– |
– |
– |
– |
Route 1A Northbound |
L |
A |
0.4 |
1 |
A |
0.3 |
1 |
Route 1A Northbound |
TR |
A |
0.4 |
1 |
A |
0.3 |
1 |
Route 1A Southbound |
LTR |
A |
0.1 |
0 |
A |
0.2 |
0 |
Monument Street |
LT |
F |
>180 |
431 |
F |
>180 |
346 |
Monument Street |
R |
F |
>180 |
431 |
F |
>180 |
346 |
Intersection Total |
– |
F |
50.3 |
– |
E |
33.3 |
– |
1A at Cherry Street |
– |
– |
– |
– |
– |
– |
– |
Route 1A Northbound |
L |
A |
3.3 |
11 |
A |
4.7 |
18 |
Route 1A Northbound |
TR |
A |
3.3 |
11 |
A |
4.7 |
18 |
Route 1A Southbound |
TR |
A |
0.1 |
0 |
A |
0.2 |
1 |
Cherry Street |
LT |
F |
>180 |
576 |
F |
>180 |
560 |
Cherry Street |
R |
F |
>180 |
576 |
F |
>180 |
560 |
Intersection Total |
– |
F |
74.1 |
– |
F |
85.8 |
– |
L = Left turning traffic. LOS = Level of Service. LT = Left and through traffic. LTR = Left, through, and right traffic. R = Right turning traffic. TR = Through and right traffic.
MPO staff also performed Signal Warrant Analysis using the methodology from the Manual on Uniform Traffic Control Devices.10 Staff reviewed Warrant 1 (eight-hour vehicular volume), Warrant 2 (four-hour vehicular volume), Warrant 3 (peak-hour vehicular volume), Warrant 4 (pedestrian volume), and Warrant 7 (crash history). All three intersections were found to warrant a traffic signal based on each of the volume criteria (Warrants 1-3), and the intersection at Cherry Street additionally was found to satisfy the criteria based on collision history. Table 4 shows a summary of the analysis, and full details are provided in Appendix E.
Table 4
Summary of Signal Warrant Analysis
Intersection |
Warrant 1 |
Warrant 2 |
Warrant 3 |
Warrant 4 |
Warrant 7 |
Route 1A at Arbor Street |
Yes |
Yes |
Yes |
No |
No |
Route 1A at Monument Street |
Yes |
Yes |
Yes |
No |
No |
Route 1A at Cherry Street |
Yes |
Yes |
Yes |
No |
Yes |
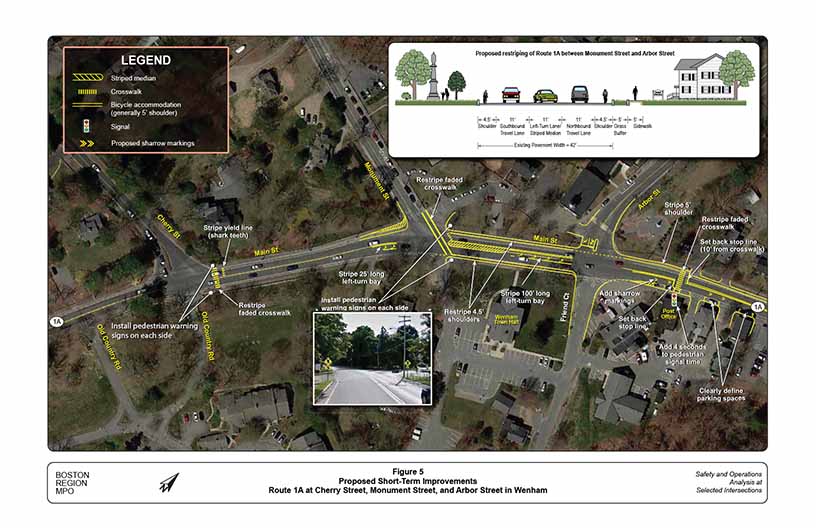
MPO staff identified several short-term improvements that would address some of the issues identified in the study area. These proposals, which are shown in more detail in Figure 5, include the following:
The short-term options make use of the existing pavement width to minimize construction time and cost. They could be implemented either as a stopgap measure while long-term alternatives are being funded and constructed, or as an alternative to the long-term proposals if the town chooses not to pursue any long-term options.
Figure 5
Proposed Short-Term Improvements
The existing conditions analysis described in the previous chapters strongly suggests that one or multiple traffic signals could improve the safety and operations within the study area. Consequently, MPO staff experimented with five improvement alternatives involving signalization and roadway reconstruction, along with a sixth that employs a roundabout control scheme. While these options would cost more and take longer to construct than the short-term alternatives discussed in the previous chapter, they also offer a greater potential to improve conditions along the corridor.
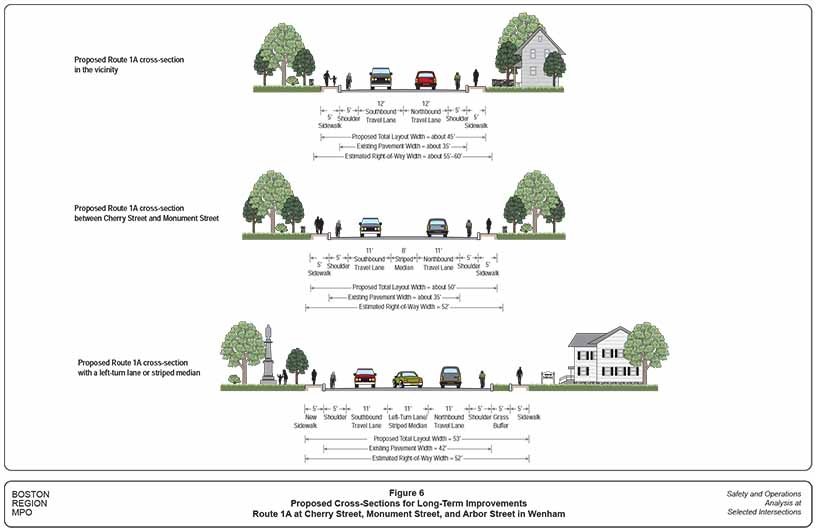
MPO staff recommends resurfacing the roadway across the length of the corridor with a new cross section that would address some of the safety and mobility issues. Figure 6 shows the proposed cross sections for different portions of Route 1A within the study area. These modifications address the following issues:
Arbor Street already has a turn bay in the existing geometry, which would be restriped for clarity but not otherwise changed.
Figure 6 also presents the approximate existing pavement width (based on aerial images) and right-of-way width (based on the town assessor’s database). It shows that the recommended cross-section will likely require expansion of the paved surface, although the required width mostly falls within the available right-of-way. The only possible exception is on Route 1A south of Cherry Street, where the abutting properties are close to the edge of the road, especially the private residence on the south corner of Cherry Street and Route 1A.
Figure 6
Proposed Cross-Sections for Long-Term Improvements
Although the issues present in the study area favor a long-term solution involving signalization, there are several options involving the number and placement of signals. MPO staff developed the following six alternatives to test different combinations of signals at the three intersections. The features and trade-offs of each alternative are discussed below.
Figure 7 shows the proposed geometry of Alternative 1, which would only install a traffic signal at the Arbor Street intersection. The other two intersections in the study area would be updated with the proposed cross-sections but would remain stop-controlled.
Alternative 1 would:
Drawbacks of Alternative 1 include:
Figure 8 shows the proposed geometry of Alternative 2, which would install a traffic signal at the Cherry Street intersection. As in Alternative 1, the other two intersections would keep their stop control.
Figure 7
Long-Term Improvements Conceptual Plan: Alternative 1

Figure 8
Long-Term Improvements Conceptual Plan: Alternative 2
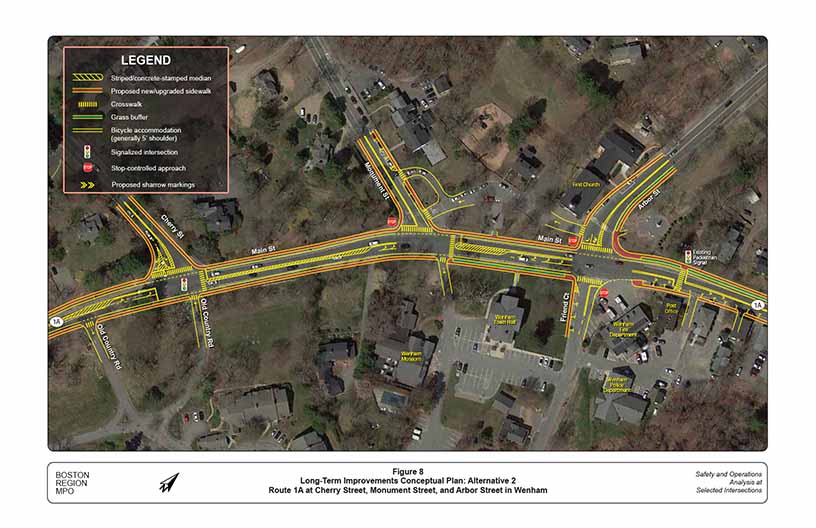
Alternative 2 would:
Drawbacks of Alternative 2 include:
Alternatives 3 and 4 involve installing two signals to control traffic and improve safety. This would improve safety and operations for a larger portion of traffic inside the study area. However, a second signal would also represent a larger investment and require more adjustment for residents who are used to the existing configuration.
Figure 9 shows the proposed geometry of Alternative 3. In Alternative 3, two coordinated signals would be installed in the study corridor, with one at Monument Street and one at Arbor Street.
Figure 9
Long-Term Improvements Conceptual Plan: Alternative 3
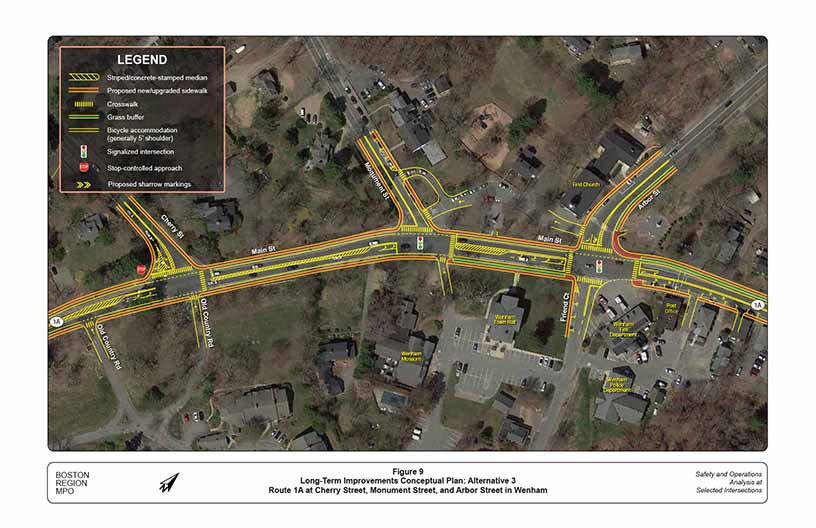
Alternative 3 would:
Drawbacks of Alternative 3 include:
Figure 10 shows the proposed geometry of Alternative 4A and 4B. Both of these alternatives would install coordinated signals at the Cherry Street and Arbor Street intersections.
Alternative 4A would:
Drawbacks of Alternative 4A include:
Alternative 4B is a variant of Alternative 4A in which left turns from Monument Street would be completely prohibited. This traffic, which is mostly cut through, would be forced to use Cherry Street instead. The inset in Figure 10 shows the geometric modifications in Alternative 4B. Adding this restriction would be an option for the town if keeping the cut-through traffic off Monument Street is a priority. It would also improve safety at the Monument Street intersection without the cost of a signal by cutting entry volume.
Figure 10
Long-Term Improvements Conceptual Plan: Alternatives 4A and 4B
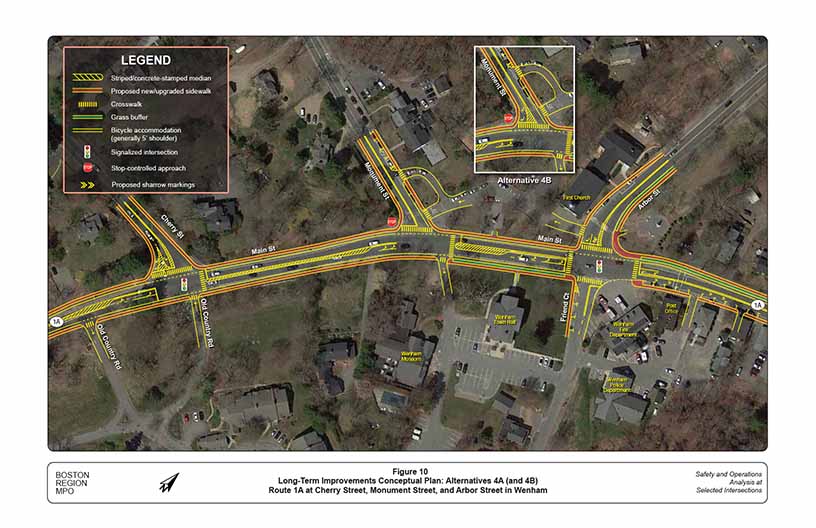
Figure 11 shows the proposed geometry of Alternative 5, which would place coordinated traffic signals at all three intersections.
Alternative 5 would:
Drawbacks of Alternative 5 include:
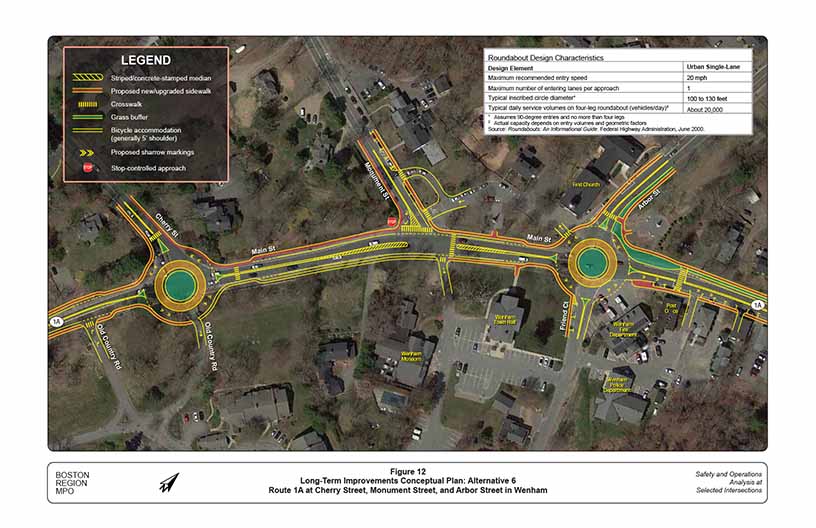
MPO staff also wanted to consider using traffic circles as an alternative to signalized control. Figure 12 shows the geometry of Alternative 6, which would install modern roundabouts at Arbor Street and Cherry Street.
Alternative 6 would:
Drawbacks of Alternative 6 include:
Figure 11
Long-Term Improvements Conceptual Plan: Alternative 5
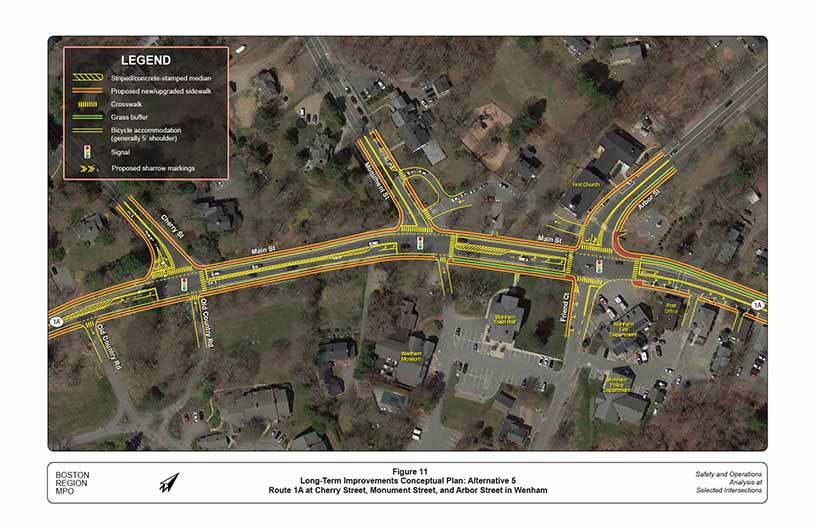
Figure 12
Long-Term Improvements Conceptual Plan: Alternative 6
MPO staff used Synchro traffic networks to model each of the long-term improvement alternatives. The capacity analysis was a particularly important tool for evaluating alternatives in this project because of the close proximity of the intersections in the study area. Tightly spaced intersections like these have complex interactions that can be difficult to anticipate using engineering judgment alone. MPO staff therefore used the traffic networks to verify that each proposed alternative would deliver the full operational benefits of signalization and provide the town with the largest possible impact from its investment.
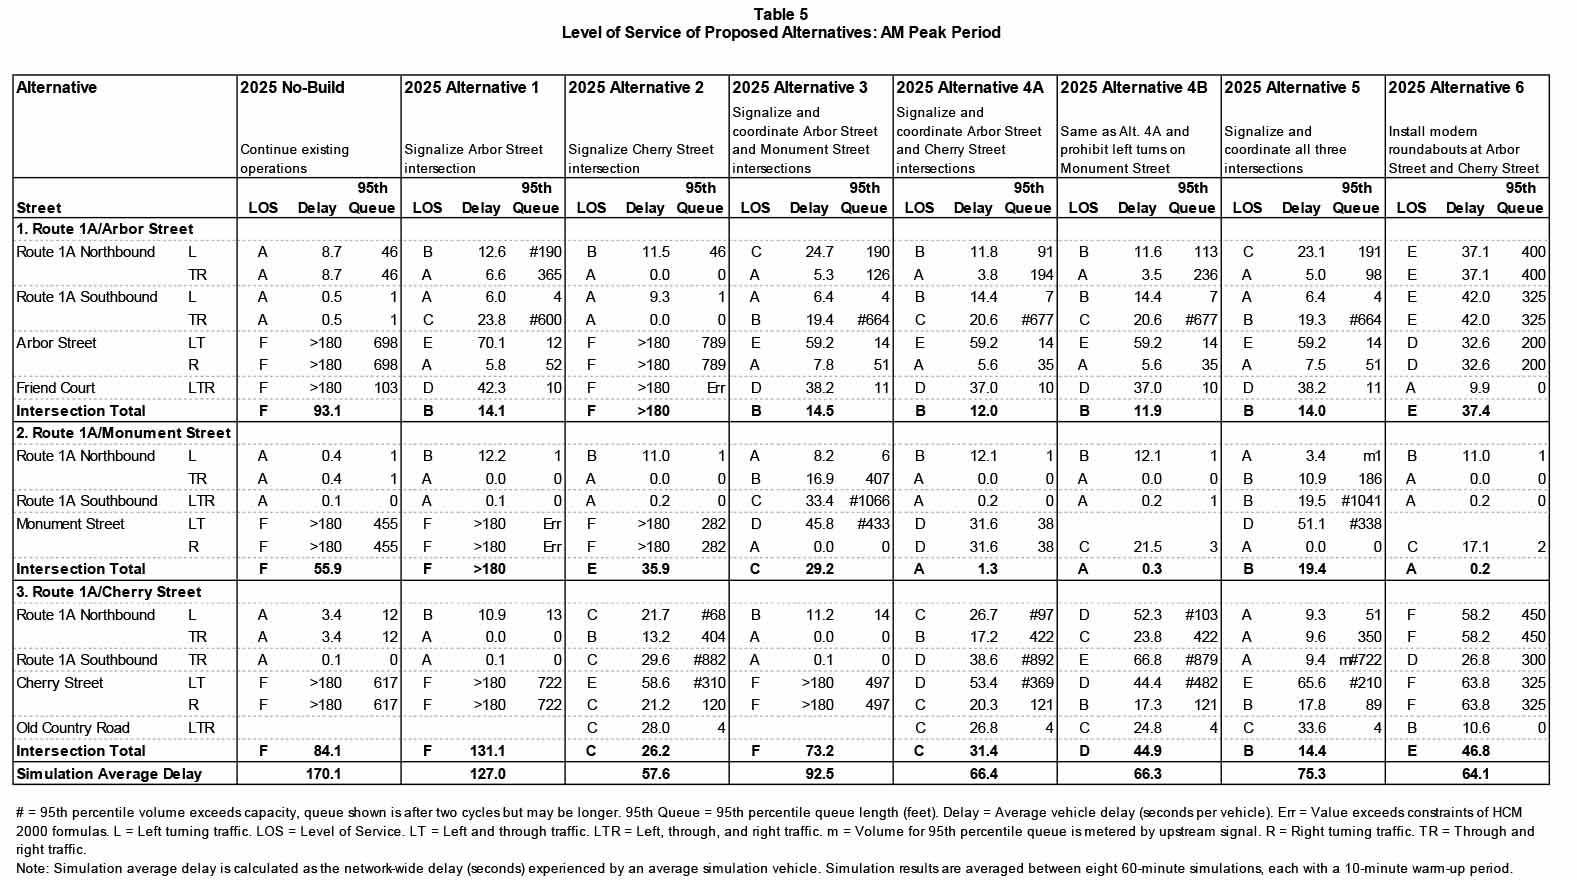
Table 5 shows the AM peak hour level-of-service results and Table 6 shows the PM peak hour level-of-service results for the traffic network. All scenarios use 2025 traffic volumes based on regional growth predictions. For this seven-year window, the MPO regional model anticipates a uniform 2 percent growth inside the study area.12
As an additional check, MPO staff also tested the networks using SimTraffic simulations, which is a module included in the Trafficware Synchro 9 suite. Traffic simulations are a useful complement to the HCM methods because they provide a visual representation of system operations and because simulations can capture some aspects of complex traffic interactions that might be overlooked by the HCM formulas. For each scenario, MPO staff averaged the results of eight one-hour simulations with a 10-minute warmup period. The last row in Table 5 and Table 6 shows the average vehicle delay, which represents the total number of seconds an average vehicle experiences between the time it enters and the time it exits the study area.
In all cases, proposed traffic signals are fully actuated with exclusive pedestrian phasing. Signal cycle lengths were capped at 110 seconds to keep pedestrian delays low. Full details of the phasing, coordination, and analysis results are included in Appendix D.
Table 5
Level of Service of Proposed Alternatives: AM Peak Period
Table 6
Level of Service of Proposed Alternatives: PM Peak Period
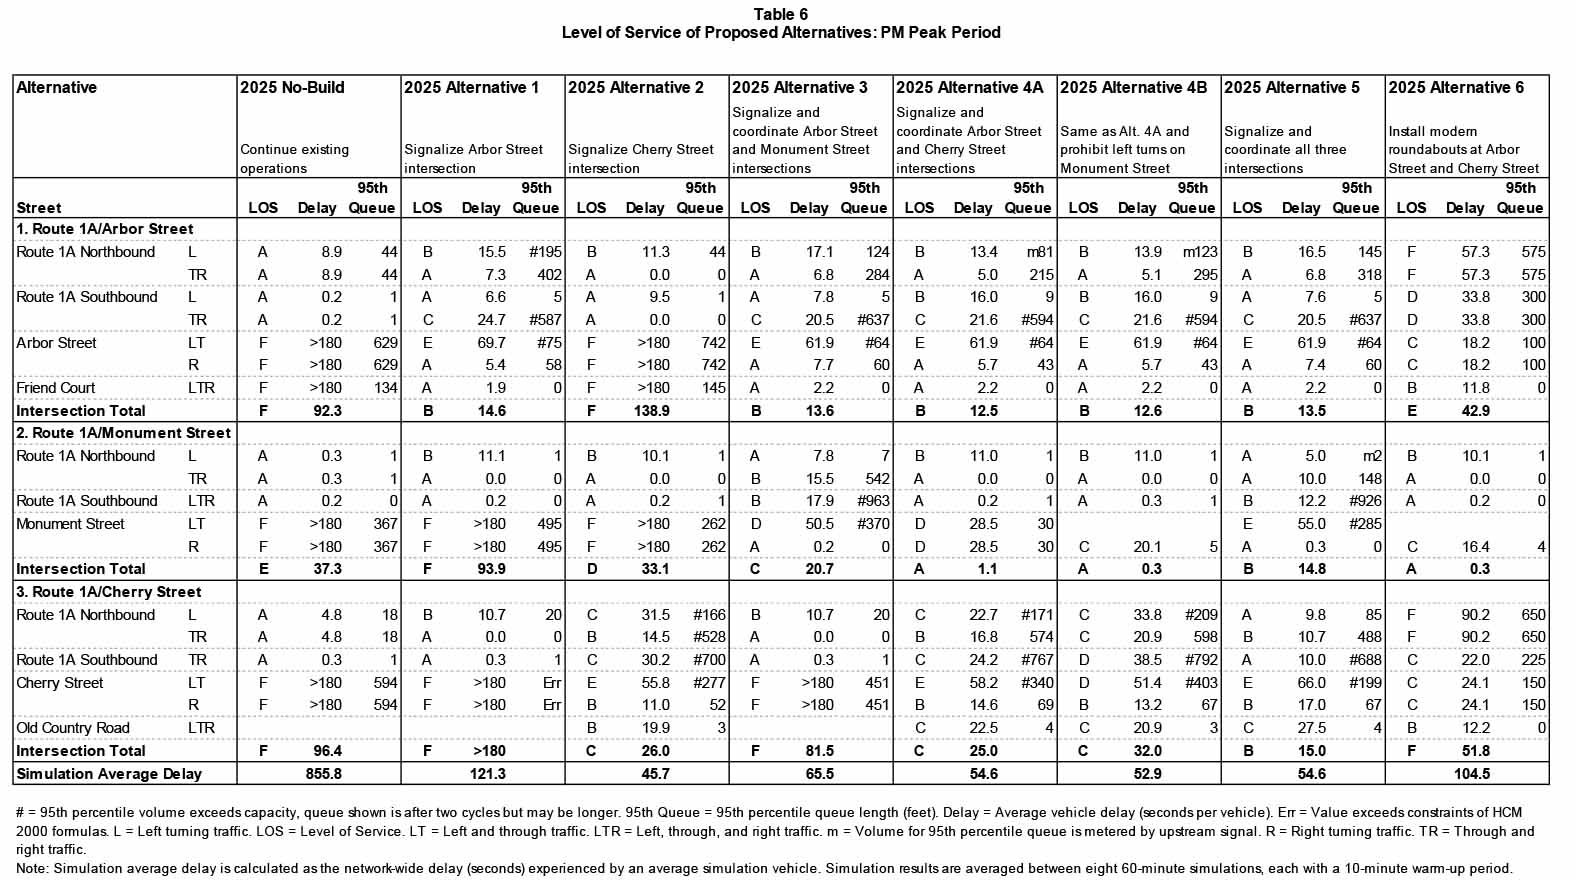
The following conclusions can be drawn from Table 5 and Table 6.
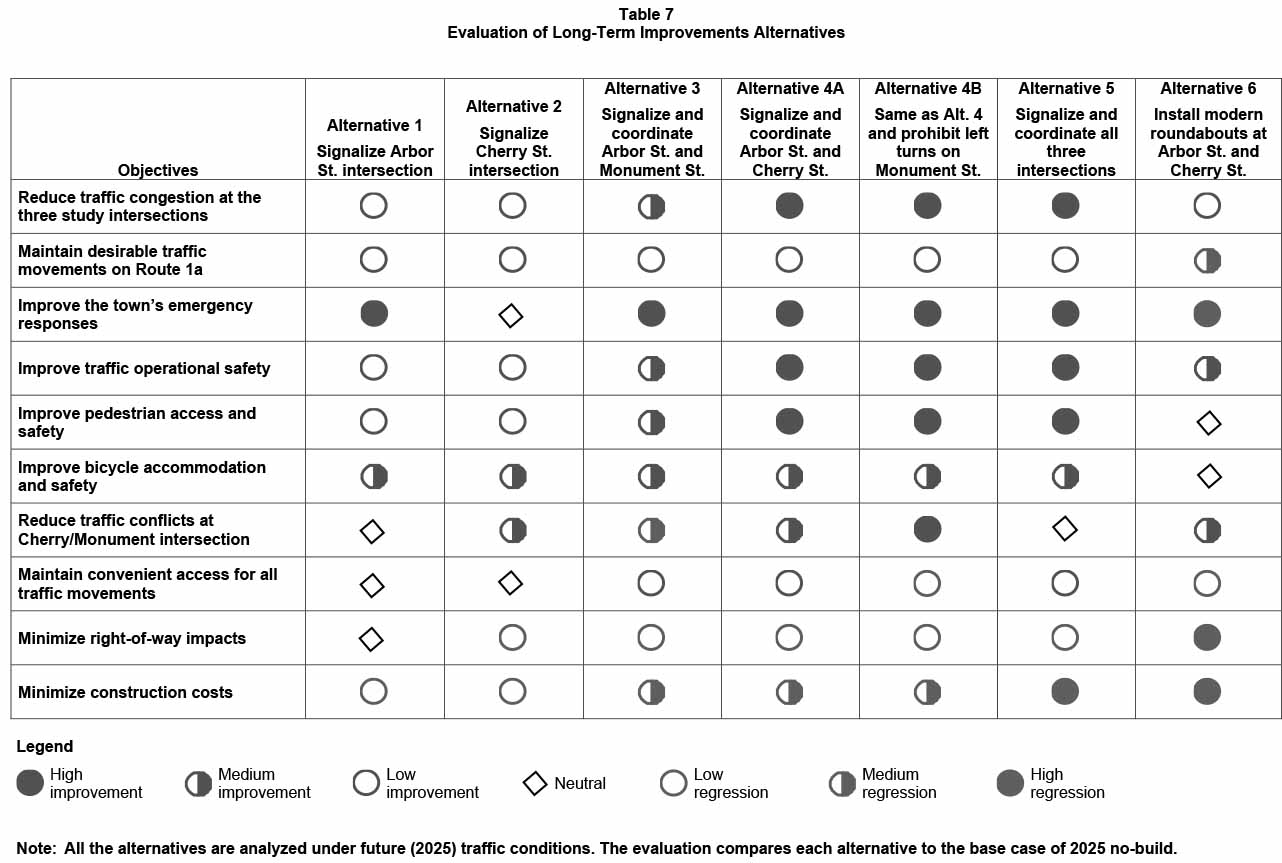
Table 7 summarizes all the previously discussed characteristics of the different design alternatives.
Table 7
Evaluation of Long-Term Improvements Alternatives
The above analyses support the need for renovations that would improve safety, operations, mobility, and emergency responsiveness at the study location.
Many of the issues present can be addressed by upgrading the pavement markings, signage, and lane configuration along the Route 1A corridor. MPO staff recommends repaving the corridor and updating the roadway cross-section as part of any selected design. The cross-sections in Figure 6 are tailored to the needs identified in the study and using a similar design would be recommended by MPO staff. However, the strategies employed in those cross-sections (tighter travel lanes, consistent shoulders for bicycles, installation of new sidewalks, clear striping and signage for pedestrian crossings, and marked turn bays) can also be adapted to other designs depending on the priorities of the town or factors such as budget, existing facilities, or available right-of-way.
The safety and operations analysis also demonstrated that signalization is warranted in the study region. Of the proposed alternatives, MPO staff recommends Alternative 4A (installation of signals at Cherry Street and Arbor Street) as the optimal solution. This alternative was shown to strike the best balance between the scope of issues addressed and the cost and complexity of the project. The Town of Wenham and MassDOT District 4 concurred that Alternative 4A is the preferred option, and MassDOT additionally expressed support for moving forward with some of the short-term improvements mentioned in the study. Comments on the proposed improvements from MassDOT and the Town are included in Appendix F.
MassDOT District 4 has jurisdiction of Route 1A and the intersections within the study corridor, and is responsible for renovations to improve safety, mobility, connectivity, and operations. This study gives the Town an opportunity to review the needs of the intersection and plan for design and engineering. The next step would be to select the preferred alternative that is sensitive to the goals and needs of stakeholders, and then advance the project through the planning process. These steps will depend upon cooperation between MassDOT, the Town of Wenham, and the MPO to begin the project notification and review process, and complete the project initiation form. After completing the initial steps, the Town of Wenham and MassDOT can start preliminary design and engineering to place the project in the Transportation Improvement Program. Transportation decision making is complex, and influenced by factors such as financial limitations and agency programmatic commitments. Project development is the process that takes transportation improvements from concept to construction (see Appendix G for an overview of this process).
This study supports the MPO’s visions and goals, which include increasing transportation safety, maintaining the transportation system, advancing mobility and access, reducing congestion, and expanding the opportunities for walking and bicycling, while also making them safer. If implemented, the improvements proposed in this report would increase traffic safety and modernize the roadway to accommodate all users.
cc: Sara Timoner, MassDOT District 4,
1Safety Conditions: Location has a higher-than-average crash rate for its functional class, contains a Highway Safety Improvement Program (HSIP)-eligible crash cluster, contains a top-200 high crash location, or has a significant number of pedestrian and bicycle crashes (two or more per mile).
2 Congested Conditions: Travel time index is at least 1.3.
3 Multimodal Significance: Location carries bus route(s), is adjacent to a transit stop or station; supports bicycle or pedestrian activities or has an implementation project to support one or more of these activities; has need to accommodate pedestrians and bicyclists and improve transit; or high truck traffic serving regional commerce.
4 Regional Significance: Location is in National Highway System; carries a significant portion of regional traffic (ADT >20,000); lies within 0.5 miles of Environmental Justice transportation analysis areas or zones; or is essential for the region’s economic, cultural, or recreational development.
5 Regional Equity: That is, it was important not to select 1) more than one location in a subregion and 2) a location in same subregion as in the preceding cycle of this study.
6 Implementation Potential: Location is proposed or endorsed by its roadway administrative agency (agencies); proposed or endorsed by its subregion and is a priority for that subregion; or has strong support from other stakeholders.
7 Safety and Operations Analyses at Selected Intersections: Federal Fiscal Year 2018, Technical Memorandum to the Boston Region Metropolitan Planning Organization. Seth Asante and Chen-Yuan Wang, January 18, 2018.
8 Trafficware Inc., Synchro Studio 9, Synchro plus SimTraffic, Build 914, Sugar Land, Texas.
9 Highway Capacity Manual, HCM 2010, Volume 3: Interrupted Flow, Transportation Research Board of the National Academies, Washington DC, December 2010.
10 Chapter 4C Traffic Control Signal Needs Studies, Manual on Uniform Traffic Control Devices, 2009 Edition with Revisions 1 and 2, Federal Highway Administration, US Department of Transportation, May 2012.
11User equilibrium traffic assignment assumes that all users choose their own route towards their destination based on the travel time that will be consumed in different route options. The traffic volume assigned to each route is adjusted until the total travel time for each route is equal.
12 The traffic growth projection is based on the transportation-planning model recently developed for the MPO’s Long-Range Transportation Plan. The model predicts that traffic in the Wenham downtown area would increase 0.3 percent annually from 2018 to 2025 in both AM and PM peak periods.