Shared-Use Mobility Services
Literature Review
Project Manager
Michelle Scott
Project Principal
Annette Demchur
Graphics
Jane Gillis
Kate Parker O’Toole
Cover Design
Kate Parker O’Toole
The preparation of this document was supported
by the Federal Transit Administration through
MassDOT 5303 contracts #88429 and #94643.
Central Transportation Planning Staff
Directed by the Boston Region Metropolitan
Planning Organization. The MPO is composed of
state and regional agencies and authorities, and
local governments.
This document provides an overview of shared-use mobility services, which involve the sharing of vehicles, bicycles, or other transportation modes, and provide users with short-term access to transportation on an as-needed basis. The report defines various types of shared-use mobility services and describes companies and service providers that operate in Greater Boston. It also includes a review of literature on the following topics:
We conclude this report with a discussion of some public policy issues—such as those pertaining to equity, competition for public-sector resources, land use, and congestion—related to shared-use modes.
Part 2—Defining Shared-Use Mobility
Part 3—Shared-Use Mobility Services in Greater Boston
3.2 Services Available In Greater Boston
3.2.2 Ridesourcing and For-Hire Vehicle Services
Ridesourcing and Public Policy
Microtransit and Public Policy
Part 4—Literature on Shared-Use Mobility Services
4.1 Literature on Shared-Use Mobility Users
4.1.1 Shared-Use Mobility Services Overall
4.2 Literature on Trips Made Using Shared-Use Modes
Travel by Time of Day and Week
Reasons for Choosing Ridesourcing
Trip Purpose and Reasons for Using Carsharing
Travel by Time of Day and Week
Travel by Time of Day and Week
4.3 Literature about Impacts on Mode Share and Vehicle Ownership
4.3.1 Shared-Use Mobility Services Overall
Vehicle Ownership and Single-Occupant Vehicle Use
4.3.2 Microtransit and Concurrent Ridesourcing
Vehicle Ownership and Single-Occupant Vehicle Use
Vehicle Ownership and Single-Occupant Vehicle Use
Vehicle Ownership and Single-Occupant Vehicle Use
4.4.1 Shared-Use Mobility Services and Mobility
4.4.2 Shared-Use Mobility Services, Transit Interactions, and Changes in Mode Share
4.4.3 Shared-Use Mobility Services and Vehicle Ownership
Part 5—Shared-Use Mobility Services and Public Policy
Access for People with Disabilities
5.3 Changes to For-Hire-Vehicle Industry
5.4 Competition for Public Sector Financial Resources
5.5 Public Safety and Insurance
table of tables
TABLE 2-1 Information Technology Support for Shared-Use Mobility
TABLE 2-2 Ridesourcing and Ridesharing Services
TABLE 2-4 Bikesharing and Scooter Sharing Services
TABLE 2-5 Alternative Transit Services
TABLE 3-1 MBTA System: Typical Weekday Ridership (FY 2015)
TABLE 3-2 Uber Services Available in Greater Boston
TABLE 5-1 Public Policy Issues and Shared-Use Mobility Services
table of figures
FIGURE 3-1 Greater Boston Young Professionals’ Use of Various Transportation Modes
FIGURE 3-2 Greater Boston Young Professionals’ Commuting Modes
FIGURE 3-3 Greater Boston Young Professionals’ Vehicle Access
FIGURE 3-4 Carsharing Availability in Greater Boston
FIGURE 4-1 SUMC Findings on Ridesourcing Demand on Weekdays
Shared-use mobility services involve the sharing of vehicles, bicycles, and other travel modes such that users have short-term access to transportation on an as-needed basis. 1 These services provide flexibility for individuals, and over the long term, may affect mode-share percentages and car-ownership decisions. It is important to understand the role of non-traditional shared-use mobility options in the Boston region’s transportation system for short- and long-term transportation planning.
In 2016, the Central Transportation Planning Staff began work on a Massachusetts Department of Transportation funded study of shared-use mobility services in Greater Boston, in order to obtain data and provide analytical insights on the following:
This literature review describes the characteristics of shared-use mobility services, including those that exist in the Boston region, and summarizes literature available on the questions below:
How have nontraditional services affected users’ mobility?
Part 2—Defining Shared-Use Mobility
Shared-use mobility services involve the sharing of vehicles, bicycles, or other modes, and offer users short-term access to transportation on an as needed, or on-call, basis, usually through a smartphone application.2 These services typically feature flexible pick-up and drop-off points, flexible schedules, or a combination of the two. They encompass new and existing forms of transportation, including carsharing and personal vehicle sharing; bike and scooter sharing; shuttle services; carpooling and vanpooling; ridesourcing, as provided by transportation network companies (TNCs) like Uber and Lyft; microtransit, such as Bridj; and courier network services (CNS). 3 While some forms of shared-use mobility, such as carsharing, have existed in the US for several decades, this family of transportation modes has experienced rapid growth in recent years. For example, Uber began operations in 2010 4, and bikeshare services have spread rapidly in the past decade. 5 Two trends are helping to drive this growth: 1) a shift in consumer behavior from a focus on ownership to a focus on access, and 2) improvements in information technology. 6
The shift in consumer behavior to a focus on access has helped spur what is often described as the “sharing economy,” which PricewaterhouseCoopers (PWC) projects will grow from $15 billion in global revenues in 2015 to $335 billion in 2025. 7 The sharing economy focuses on using assets, such as household vehicles or living spaces, more efficiently, including utilizing these assets during times when they would otherwise be empty or idle. 8 The shared-use mobility sector, which provides consumers with short-term access to automobiles, bicycles, shuttles, and other modes, has been identified as one of the highest-profile and most dynamic sectors of the sharing economy. 9 Researchers studying the transportation behaviors of millennials—defined as Americans born between 1983 and 2000—report that this group may provide clues as to how people will travel in the future, and have identified decreases in their group’s rates of applying for driver licenses, using cars to travel to work, and number of vehicle-miles traveled. 10 A survey conducted by Deloitte found that only 64 percent of generation Y—roughly defined as individuals born between born 1977 and 1994—consumer respondents in the United States said their preferred mode of transportation was a car that they own, compared to 81 percent of consumer respondents representing other generations.11 Moreover, the survey found that US generation Y respondents are three times as likely to give up a personal vehicle, as are previous generations.12
The shared-use mobility market, and the sharing economy as a whole, is supported by the second trend: advancements in information technology. Table 2-1 highlights ways that technology supports shared-use mobility services.
TABLE 2-1
Information Technology Support for Shared-Use Mobility
Information Technology |
Shared-Use Mobility Function |
Web and mobile (smartphone) applications |
|
Remote vehicle locking systems |
|
Global positioning systems data |
|
Enhanced data management and processing capabilities |
|
Data Source: Transportation Research Board Committee for Review of Innovative Urban Mobility Services 13
From a consumer standpoint, access to smartphones is particularly important, because smartphones enable users to connect to the mobile and web applications that support many shared-use mobility services. The Pew Research Center reports that 64 percent of American adults owned a smartphone in 2015, up from 35 percent in 2011. Ownership levels have reached 85 percent among youth (ages 18-29) and 84 percent among households with annual household incomes greater than $75,000. 14 The center’s research shows that smartphones and mobile applications play diverse roles in helping people to access transportation:
The convergence of technology and trends that surround the sharing economy also support a wide variety of transportation services in the shared-mobility market. This study focuses specifically on shared-use mobility services that: 1) provide surface transportation for passengers within (as opposed to between) metropolitan areas; and 2) are available to the public. However, broader definitions of shared-use mobility include services for closed communities, such as university bike-sharing systems, and on-demand package delivery services, such as Postmates. They also include services that support intercity transportation, such as Skedaddle, which crowdsources demand for routes served by luxury coaches. Web- and mobile-based trip planners and service-aggregator applications, such as Daimler-owned moovel (formerly Ridescout and Globe Sherpa) also operate in the shared-use mobility ecosystem by helping riders identify their preferred travel routes and mode(s) based on cost, environmental impact, and time considerations. 18
Establishing definitions for various services is both important and complex, because the shared-use mobility sector continues to evolve rapidly. The Transportation Research Board recommends that consistent definitions and basic information for shared-use mobility services be established so that regulatory entities can effectively describe and evaluate these services.19 In the absence of standard definitions, Tables 2-2 through 2-5 classify services using a combination of schemes suggested by researchers, and list alternative terms for particular services, where applicable. These tables describe four categories of services that meet these criteria: ridesourcing and ridesharing, carsharing, bike and scooter sharing, and alternative transit.
Parts 3, 4, and 5 of this literature review focus on a subset of the services described in Tables 2-2 through 2-5: ridesourcing (sequential and concurrent), round-trip and one-way carsharing, public bikesharing, and microtransit.
TABLE 2-2
Ridesourcing and Ridesharing Services
| Transportation Type |
Subtype |
Definition |
Other Features |
Examples of Boston-area Services |
Other Examples |
|---|---|---|---|---|---|
Ridesourcing/ Transportation Network Services |
Transportation Network Services (sequential travel) |
Passengers use a mobile application to arrange trips and pay drivers, who provide trips using their personal, or rented, vehicles. Drivers drop off individual passengers (or groups of related passengers) before picking up new passengers. Drivers do not pick up street-hails. |
Services may vary by vehicle type (e.g., uberSUV or LyftPlus, which provide larger vehicles for groups). Services may also be tailored to specific populations (e.g., Zemcar for children and families) or types of trips (e.g., Wingz for airport trips). |
uberX, Lyft, Fasten, Zemcar |
Juno (NYC), RideAustin |
Ridesourcing/ Transportation Network Services |
Transportation Network Services (concurrent travel, or ridesplitting) |
Transportation network companies (TNCs) match unrelated riders with similar origins and destinations together for on-demand trips to reduce the number of vehicle trips and generate cost savings. Additional passengers can be added to a trip in real time. |
null |
uberPOOL, Lyft Line |
null |
Ridesourcing/ Transportation Network Services |
On-demand (or web-accessible) Professional Driver Services (“e-hail”) |
Passengers use a mobile application to find, hail, and in some cases pay for a professional driver (taxi or black car) for an on-demand or pre-arranged trip. |
Passengers may be matched with professional drivers via transportation network services or other third-party applications. Some municipalities may require taxis to use a city-certified application. |
Curb, Arro, uberBLACK, uberTAXI, ZTrip |
Flywheel (Los Angeles), DC TaxiApp (Washington, DC) |
Ridesharing |
Carpooling |
Individuals coordinate to travel together in a privately owned vehicle, typically for commuting. In formal systems, an intermediary organization often helps facilitate connections between users. |
Carpooling arrangements may be acquaintance-based, employer-based, or ad-hoc. Real-time approaches match drivers and passengers based on destination using a mobile app. |
NuRide |
Carma Carpooling (Bay Area), Scoop (Bay Area), SPLT (Atlanta, New York, Detroit) |
Ridesharing |
Vanpooling |
Volunteer drivers bring commuters to a common destination in a third-party owned vehicle. |
Services often target employers (rather than individuals), who arrange service for groups of employees traveling between similar destinations. |
vRide, Zimride, Yes We Van |
null |
Data Sources: Boston Globe20 ; Institute for Transportation Development and Policy and Living Cities21 ; ITS America22 ; Shared Use Mobility Center23 ; Shaheen and Christensen24 ; Transportation Research Board Committee for Review of Innovative Urban Mobility Services 25 ; Shaheen et al., 2015.26
Note: The “Examples of Boston-area Services” column attempts to captures known services operating in and around Boston as of October 2016. The “Other Examples column” attempts to capture known services operating in other cities. This table does not necessarily list all cities where these services are active.
| Transportation Type |
Definition |
Other Features |
Examples of Boston-area Services |
Other Examples |
|---|---|---|---|---|
| Carsharing (Round-Trip) |
Users access an operator-owned fleet of automobiles for short-term (typically hourly) rentals, and return vehicles to the original pick-up location. Round trip is the most common model of carsharing operation. |
Carsharing operators are typically responsible for the cost of maintenance, storage, parking, and insurance/fuel (if applicable). Many carsharing programs have agreements with municipalities to allow for free on-street parking, and may receive support from the public sector. |
Zipcar, Enterprise Carshare, Maven |
null |
| Carsharing (One-Way) |
Users access an operator-owned fleet of automobiles for point-to-point trips. Vehicles can be returned to any designated space within a specific geographic area. |
One-way systems are made possible through coordination between cities and carsharing operators over parking agreements. |
Zipcar One-Way |
car2go (Seattle, Denver, Austin, Twin Cities), Maven (Detroit, Ann Arbor) |
| Carsharing (Peer-to-Peer) |
Individual vehicle owners make their cars available for short-term rentals, which are managed by a third party. |
Third-party management companies typically provide an online platform, customer support, automobile insurance, and vehicle technology. Personal auto insurance policies generally do not protect owners who rent out their cars for money; commercial policies are generally required. |
Turo |
Getaround (San Francisco, Chicago) |
| Carsharing (Fractional Ownership) |
Individuals subscribe to or sublease a vehicle owned by a third party and share the use of that vehicle. |
Often used with luxury cars or recreational vehicles. |
null |
CurvyRoad (Chicago) Gotham Dream Cars (New York, Miami) |
Data Sources: Cooper and Timmer (2015) 27; Shared Use Mobility Center 28; Shaheen and Christensen (2015) 29; Transportation Research Board Committee for Review of Innovative Urban Mobility Services 30; Shaheen et al., 2015 31; TechCrunch. 32
Note: The “Examples of Boston-area Services” column attempts to captures known services operating in and around Boston as of October 2016. Examples column” attempts to capture known services operating in other cities. This table does not necessarily list all cities where these services are active.
TABLE 2-4
Bikesharing and Scooter Sharing Services
Transportation Type |
Definition |
Other Features |
Example of Boston-area Services |
Other Examples |
Bikesharing (public) |
Users access a fleet of bicycles used primarily for point-to-point trips. |
Fleets may use bike docks or be dockless; in the latter case, supporting technology is embedded into the bike or lock. Operators are typically responsible for maintenance, storage, and parking. Users pay a fee that typically allows an unlimited number of trips in a defined time interval. |
Hubway (public) |
CitiBike (New York), Capital Bikeshare (Washington, DC Metro area), Divvy (Chicago) |
Bikesharing (peer-to-peer) |
Users rent or borrow bicycles from individuals via a mobile/web application or a bike rental shop. |
Third parties provide applications to match renters and owners. |
Spinlister |
null |
Scooter Sharing |
Users access operator-owned fleets of scooters for short-term rentals. |
null |
null |
Scoot (San Francisco) |
Data Sources: Shared Use Mobility Center33 ; Shaheen and Christensen 34; Transportation Research Board Committee for Review of Innovative Urban Mobility Services. 35
Note: The “Examples of Boston-area Services” column attempts to captures known services operating in and around Boston as of October 2016. Examples column” attempts to capture known services operating in other cities. This table does not necessarily list all cities where these services are active.
TABLE 2-5
Alternative Transit Services
Transportation Type |
Definition |
Other Features |
Example of Boston-area Services |
Other Examples |
Microtransit |
Company-employed drivers operate private shuttle services on dynamically generated routes. |
Microtransit services can include variations of: 1) a fixed-route, fixed-schedule model; or 2) a flexible-route, on-demand scheduling model. |
Bridj |
Chariot (San Francisco Bay Area), Via (New York City), OurBus (New York and New Jersey) |
Shuttles/Jitneys |
Private operators provide bus or shuttle service for community or commuter transportation purposes. Jitneys operate like taxis or buses, but often without official licenses. |
Shuttle types include circulator shuttles, which connect destinations in close proximity but not within walking distance, Transportation Management Association (TMA) and employer shuttles. |
Route 128 Business Council Shuttles, EZRide Shuttle |
null |
Demand-responsive Transit |
These services typically serve niche markets, where users often have special needs (e.g., aging communities, people with disabilities). Services usually have flexible routes and require advance booking for drop-off and pick-up. |
null |
MBTA The RIDE |
null |
Data Sources: Institute for Transportation Development and Policy and Living Cities36 ; Shared Use Mobility Center37 ; Shaheen and Christensen (2015)38 ; Shaheen et al. (2015)39 Next City.40
Note: The “Examples of Boston-area Services” column attempts to captures known services operating in and around Boston as of October 2016. Examples column” attempts to capture known services operating in other cities. This table does not necessarily list all cities where these services are active.
Part 3—Shared-Use Mobility Services in Greater Boston
Greater Boston, as defined by the area served by the Metropolitan Area Planning Council (MAPC) and the Boston Region Metropolitan Planning Organization (MPO), includes 101 municipalities, extending from Boston to Ipswich in the north, Duxbury in the south, and to approximately Interstate 495 in the west.41 According to the MPO’s current Long-Range Transportation Plan, the median age of the region’s residents is 37.9 years.42 Fifty percent of the region’s households earn more than $75,000, though another 22 percent earn less than $29,000. Approximately 71 percent of residents travel to work by car, truck or van, while another 16 percent travel to work by public transportation. The region also has a significant number of zero- and one-vehicle households, totaling more than half of all households, at 53 percent.
Recent survey research funded by the Urban Land Institute (ULI) Boston/New England sheds some light on how people in Greater Boston may use shared-use mobility services. In October 2015, the MassINC Polling Group surveyed 660 college-educated young professionals between the ages of 20 and 37 on behalf of the ULI Boston/New England.43 The survey included several questions on transportation, including respondents’ usage of shared-use mobility services; the responses to these questions are shown in Figures 3-1 to 3-3. While more than three-quarters of respondents have had experience with ridesourcing, less than 10 percent use these services to commute on a regular basis. Approximately 18 percent have access to a carsharing vehicle.
FIGURE 3-1
Greater Boston Young Professionals’ Use of Various Transportation Modes
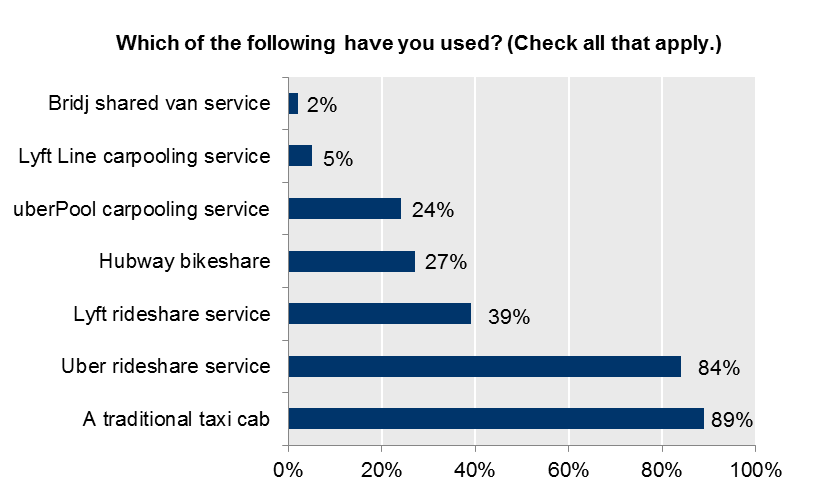
Data Source: Mass INC Polling Group, for ULI Boston/New England.44
FIGURE 3-2
Greater Boston Young Professionals’ Commuting Modes
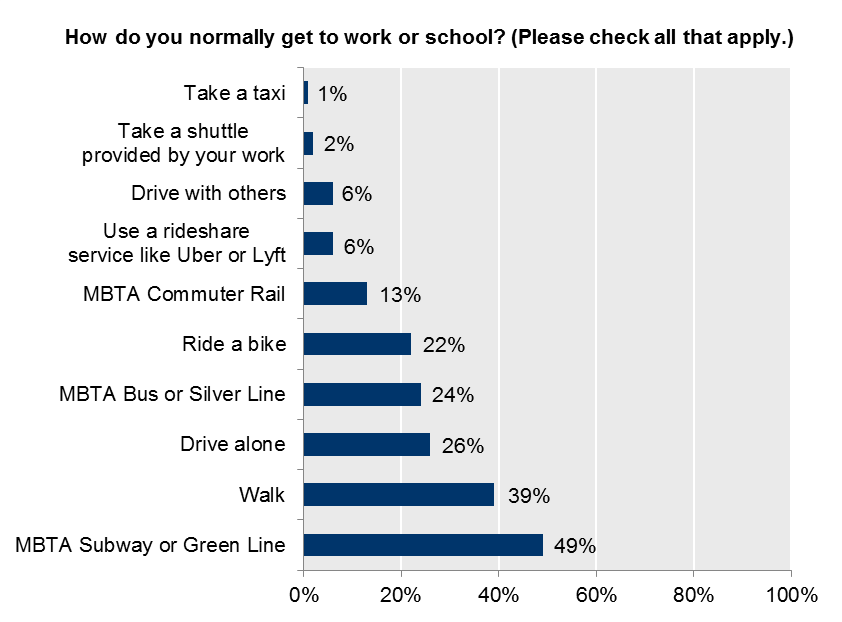
Data Source: Mass INC Polling Group, for ULI Boston/New England.45
FIGURE 3-3
Greater Boston Young Professionals’ Vehicle Access
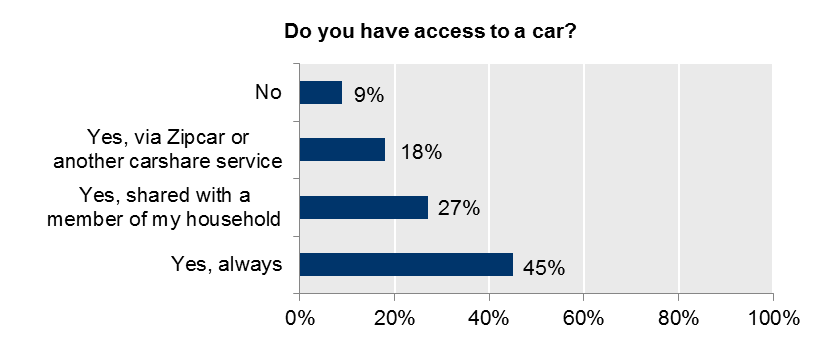
Data Source: Mass INC Polling Group, for ULI Boston/New England.46
The sections below provide details on specific shared-use mobility operators that provide service in the Greater Boston area.
Transit has been referred to as the backbone of shared-use mobility systems.47 The Boston Region MPO area is served by six regional transit authorities and other transit providers, but the majority of service is provided by the Massachusetts Bay Transportation Authority. Table 3-1 summarizes the ridership characteristics of various components of the MBTA (T) system.
TABLE 3-1
MBTA System: Typical Weekday Ridership (FY 2015)
MBTA Service |
Average Weekday Ridership in Unlinked Trips |
Heavy Rail (Red, Orange, and Blue Lines) |
568,500 |
Green Line (Light Rail and Trolley) |
186,600 |
Bus Network (including Silver Line and Trackless Trolley) |
444,510 |
Commuter Rail (inbound and outbound boardings) |
121662 |
Contracted Bus |
3,000 |
The RIDE Paratransit (trips delivered) |
7,100 |
Ferry |
4,700 |
Data Source: MBTA.
Notes: Values have been rounded to the nearest hundred unlinked trips. Unlinked trips are measured in the number of passengers who board public transportation vehicles.
Uber began operating in its home city of San Francisco in 2010 and began serving Boston and other US cities in 2011. The ridesourcing company currently operates in 549 cities worldwide.48 Uber offers several types of services within the Boston area, which are listed in Table 3-2. Uber is generally available throughout Massachusetts, and the ridesourcing cost comparison tool Uphail identifies Uber as serving 99 municipalities within the Boston Region MPO area.49 As shown in Table 3-2, however, some Uber services are only available in specific geographic areas.
TABLE 3-2
Uber Services Available in Greater Boston
Service Type |
Service Description |
Known Geographic Limits |
uberBLACK and uberSUV |
Riders are matched with livery drivers (black car service). uberSUV serves six or more passengers. |
null |
uberX and uberXL |
Riders are matched with “regular drivers” without commercial vehicle licenses. |
null |
uberTAXI |
Uber app enables riders to request and pay for a taxi. |
Only eligible for Boston, Brookline, and Somerville taxis. |
uberPOOL |
Two or more riders can share a trip and related costs (concurrent ridesourcing). |
From Boston, available as far east as Salem, as far north as Andover, as far west as Marlborough, and as far south as Bridgewater. |
Sources: Commonwealth Magazine50 ; Uber.51
Reuters reported that as of August 2016, Uber and its competitor Lyft (described below) provided approximately 2.5 million rides per month in Massachusetts.52 The Boston Globe reported that according to the companies, Uber provided more than 2 million rides, and Lyft supplied more than a half million rides.53 Uber began offering its uberPOOL service in the Boston area in 2015, and expanded the service area during 2016. As the service reached the six-month mark, Uber reported that residents of Roxbury and Dorchester use uberPOOL nearly two times more than did riders in other parts of the city.54 In August 2016, Uber reported that 5 million uberPOOL trips had been made in Massachusetts—though it did not specify information about riders per trip—and that across Massachusetts cities, UberPOOL facilitated more than 6.4 million shared miles between passengers. 55 Uber also reported that, as of July 2016, 30 percent of rides in Greater Boston were UberPOOL rides.
During summer 2016, Uber tested flat-rate pricing on UberPOOL trips56 , and in January 2017, it offered $4.99 flat-rate UberPOOL trip packages in a designated zone that covers Boston and surrounding areas within Greater Boston’s core.57
Lyft, founded in San Francisco in 2012, began its operations in greater Boston in 2013. According to researchers at 7Park Data, Lyft holds a market share of 18 percent in Boston, compared to the 82 percent share held by Uber.58 Lyft Line, which serves 14 US markets, became available in the Boston area in September 2015.59 As of January 2016, Lyft operated in approximately 200 cities.60 Lyft appears to serve slightly fewer municipalities in Massachusetts than does Uber.61 In greater Boston, Lyft offers three different services:62
Fasten began operating in October 2015 and offers service in the region’s core municipalities.63 Cambridge-based Zemcar, launched in December 2015, provides ridesourcing services for family “dependents,” including seniors and children.64
According to the Bureau of Labor Statistics, as of May 2015, there were 3,810 taxi drivers and chauffeurs employed in the Boston-Newton-Cambridge metropolitan area, which includes Boston and 91 surrounding municipalities.65 Taxi companies in cities around the US have adopted e-hailing smartphone apps that passengers can use to hail cabs and pay for their rides. Several e-hail applications for taxis are in use in the Boston area, including Curb, offered by Verifone, and Arro, offered by Creative Mobile Technologies (CMT).66 Curb is used in 60 cities nationwide, including Cambridge and Newton, to process taxi payments and receive pick-up requests.67 Verifone systems are available in approximately one-third of Boston cabs, while CMT systems are available in the remaining two-thirds. Arro can only be used in cabs with CMT systems. Service uses “surge pricing,” which refers to a service provider adjusts prices to balance driver supply with rider demand and minimize riders’ wait times for rides.68
In August 2016, Massachusetts Governor Charlie Baker signed Chapter 187 of the Acts of 2016—An Act Regulating Transportation Network Companies—into law. Elements of this legislation include double background checks for drivers, insurance requirements, and a twenty-cent-per-ride fee that would be phased out over about 10 years.69 This fee will be split among municipalities, the state, and a fund to “provide financial assistance to small businesses operating in the taxicab, livery, or hackney industries,” in order to help taxi services adopt new technology, improve service, and develop their workforce.70 The new law prohibits Massachusetts municipalities from requiring TNCs or TNC drivers to obtain additional licenses or from subjecting TNCs or TNC drivers to local rates or requirements; although municipalities and other local and state entities may regulate traffic flow and traffic patterns to ensure public safety and convenience.71
A new division of the Department of Public Utilities will be responsible for implementing the law, which does not have any provisions specific to the taxi industry.72 The law also calls for the creation of a task force to review existing laws, regulations, and local ordinances pertaining to taxis, livery vehicles and TNCs. This task force also would develop recommendations for a range of topics, including public safety, the equity of the regulatory structure in the ride-for-hire industry, the use of “surge pricing,” and the feasibility of establishing a Massachusetts Accessible Transportation Fund to support wheelchair accessible service.73 The Boston Taxi Owners Association has since filed a lawsuit, challenging that the new law is unconstitutional because municipalities cannot regulate TNCs the same way they do taxis.74
To date, the only formal microtransit provider operating in Boston is Bridj, which began service in 2014.75 Bridj transports its riders using 14-passenger vans operated by professional drivers. Bridj reports that its algorithm uses data provided by riders—along with information from Google Earth, social media, the Census, and other sources—to analyze travel patterns, then uses this information to create transit routes that take riders between concentrated origin-destination pairs.76 The service uses real-time data to predict areas of peak demand and adjust schedules, and as more people make reservations through its smartphone application, Bridj dynamically adjusts routes to optimize travel times and routes for passengers.77 Its algorithm determines a central passenger meeting spot based on the location with the most requests.78
Currently, Bridj provides service connecting several areas in the core of Greater Boston:79
The company, which also operates in Kansas City, has discussed plans to expand into other Boston neighborhoods, of Somerville and Newton, and other Greater Boston communities.80
Boston is also served by Skedaddle, which opened in Boston in June 2015 and now operates in several other cities. 81 This app enables riders to crowdsource intercity bus service, with specific routes becoming “activated” if they have 10 or more people 48 hours before a scheduled departure. Between the summer of 2015 and early 2016, approximately 45,000 riders had used Skedaddle to travel from Boston and New York to surrounding suburbs. The company has defined its primary competitors as Amtrak and Greyhound, not more-local options like Uber, Lyft, or Bridj.
Bridj initially applied for jitney licenses to operate in Boston, Brookline, and Cambridge in 2014.82 While the first two municipalities approved the licenses, Bridj operations in the City of Cambridge were contingent upon the completion of a pilot program, during which the city evaluated noise, safety, and congestion, among other issues. The primary Bridj routing during the pilot program was between Kendall Square, Boston’s Allston neighborhood, and the Town of Brookline (generally the Coolidge Corner area). 83 The city also prohibited Bridj from stopping at several locations in Cambridge or from using certain roadways for through trips and monitored Bridj stops at four heavily used MBTA bus stops near Central, Harvard, and Porter Squares. Bridj received approval for its jitney license in September 2015. 84
Zipcar was founded in the Boston area in 2000, with its first reservation made near Central Square in Cambridge.85 The service—with more than 950,000 members 86—now operates in more than 30 major metropolitan markets and more than 500 college campuses throughout the United States, Canada, the United Kingdom, Germany, Austria, Spain, France, and Turkey. 87 As of February 2015, Zipcar had approximately 1,000 round trip-cars available throughout greater Boston.88 Currently Zipcars are available at 18 Red Line, 31 Green Line, 12 Orange Line, and 6 Blue Line stations, and at 20 commuter rail stations.89 Zipcar reports that its most popular pod, or carsharing vehicle location, is in the neighborhood around Northeastern University.90 While round-trip vehicles must be returned to their original location, Zipcar also includes 200 cars in its ONE>WAY program, which was made available to all Boston residents in December 2014.91 ONE>WAY vehicles can be reserved only 30 minutes in advance of a trip, but drivers can drop-off the vehicle at one of a number of open designated parking spots. The driver may change her vehicle drop-off location during the course of the reservation.
Enterprise Carshare began operations in the Boston area in 2012, after acquiring Mint Cars-on Demand.92 It now has vehicles in Boston, Brookline, Cambridge, Chelsea, Malden, and Somerville.93 All of Enterprise Carshare’s vehicles in Greater Boston—that number between 170 and 200—are for round-trip usage.94
The General Motors-owned carsharing service Maven began operating in Boston in 2016, and formed partnerships with developers to obtain parking spots.95 The Chicago-based Shared Use Mobility Center reports that as of June 2016, approximately 1,900 carsharing vehicles were available in the Boston region.96 Figure 3-4 shows the locations of Zipcar and Enterprise Carshare vehicles.
FIGURE 3-4
Carsharing Availability in Greater Boston
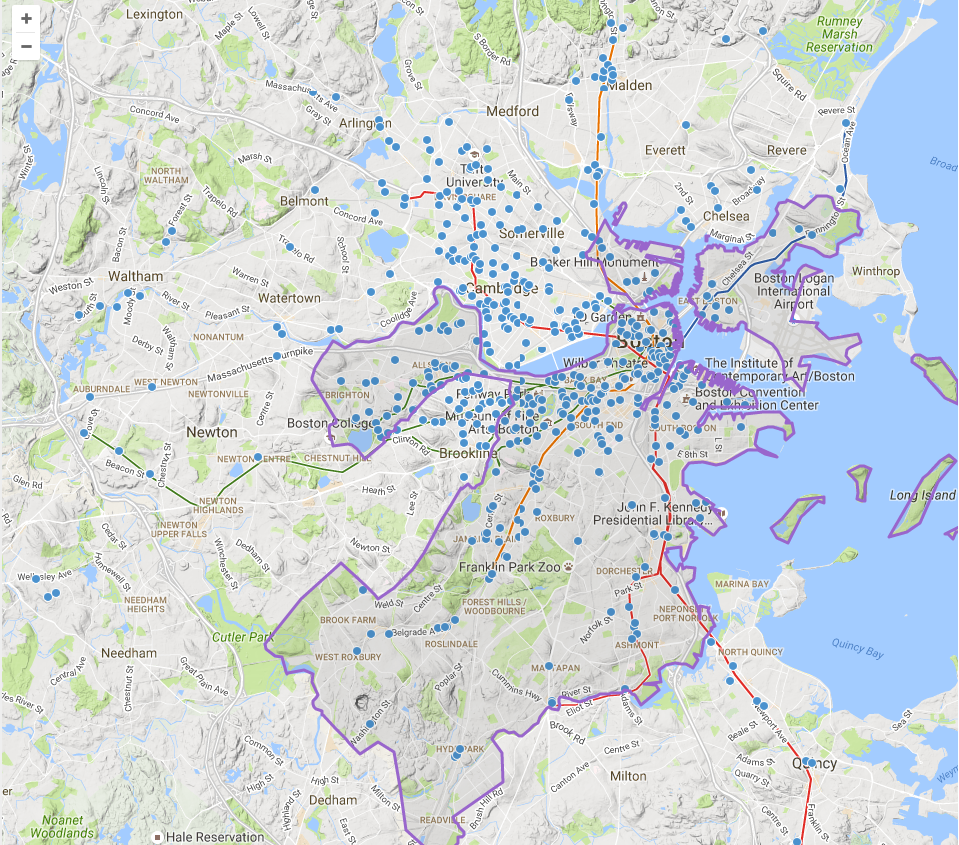
Figure Source: Shared Use Mobility Center, Shared Mobility Mapping Tool.97
Note: Blue dots represent the location of Zipcar and Enterprise Carshare vehicles.
At least one peer-to-peer carsharing service—Turo—operates in Greater Boston, and enables people to rent vehicles directly from individual owners using their smartphone or the company website.
Both Enterprise Carshare and Zipcar are participating in the City of Boston’s DriveBoston pilot, which reserves 80 municipal parking spots—49 in municipal lots and 31 curbside—as parking for carshare vehicles.98 Enterprise Carshare and Zipcar each have 40 vehicles in the program. Zipcar has purchased an additional 150 “free-floating” permits from the City of Boston, so that drivers may pick up and drop off cars at any legal spot without needing a residential permit.99
The Boston area’s Hubway system features dedicated docking stations and automated credit card payment.100 Hubway began operating in Boston in 2011 and expanded to Cambridge, Brookline, and Somerville in 2012.101 The system is owned by the governments of the Cities of Boston, Cambridge, and Somerville, and the Town of Brookline. The MAPC oversees the interaction and use of the system between municipalities. Motivate, formerly Alta Bicycle Share, is the contractor that designs, deploys, and manages the Hubway system. Motivate also operates bikeshare systems in Seattle, Toronto, Chicago, New York, and Washington, DC.102
As of the end of 2015, Hubway’s footprint covered approximately 25 square miles and included 155 stations and 1,500 bikes.103 Hubway reports that a docking station serves every line of the MBTA rapid transit, commuter rail, and ferry systems, as well as more than 60 bus routes, to accommodate multi-modal trips. In 2015, the system served about 1.14 million trips, had 13,248 members, and sold approximately 102,000 24- and 72-hour passes to casual users. The GoBoston 2030 study identified top Hubway trip origin-destination pairs, which include those between North and South Stations, and along the Massachusetts Avenue Bridge between Boston and Cambridge.104
Boston also is home to one peer-to-peer bike share service: Spinlister, which operates in cities around the US and Europe. Individuals who own bikes, skis, surfboards, and snowboards can make these items available for rent at the Spinlister sites.
Part 4—Literature on Shared-Use Mobility Services
CTPS reviewed literature on shared-use mobility services that relates to the questions listed in Part 1 of this report:
To respond to these questions, CTPS collected information that discusses
In 2016, the Shared Use Mobility Center (SUMC) released Transit Cooperative Research Program (TCRP) Research Report 188: Shared Mobility and the Transformation of Public Transit, which examined the relationship between public transportation and shared-use modes. Some of the results of this study were released several months earlier through a research analysis for the American Public Transportation Association (APTA). The SUMC surveyed approximately 4,500 shared-use mobility service users in Austin, Boston, Chicago, Los Angeles, San Francisco, Seattle, Washington, DC, and New York City.105 For purposes of the study, shared-use mobility included transit as well as bikesharing, carsharing, ridesourcing, and ride-splitting (concurrent ridesourcing), although some survey results distinguish between transit and other modes.106 This survey relied on convenience samples of transit and shared mobility users, who were contacted by service operators, and the research team notes that the sample of user characteristics may not be representative of these populations overall.107 The research team identified these characteristics among their respondent group, which included users of all shared modes, including transit.108
The results of this survey suggest some information about how the use of shared-use mobility services may vary by income level. The research team found that while households access the transportation system in different ways depending on income level, public transit (bus or rail) was “by far the top shared-use mode at every level.”114 More than 60 percent of respondents overall identified transit (public bus or train) as their most commonly used shared mode, while 57 percent of the supersharers sample identified transit as their most commonly used shared mode.115 Lower-income respondents likely would take the bus, while higher-income respondents likely would take the train, as train use increased with income level.116
Of the overall sample population, 12 percent identified carsharing and 12 percent identified bikesharing as their most commonly used shared mode.117 The research team found that carsharing was evenly popular across income levels, while bikesharing was more popular among households with higher incomes.118 In every income category, 10 percent or fewer of respondents identified ridesourcing as their top shared-use mode. Forty-eight percent of respondents reported traveling by train once or more per week, followed by 45 percent traveling by bus, 42 percent driving alone, and 27 percent using bike share.119 Fewer than 20 percent used carsharing or ridesourcing once or more per week.
The sections below provide information on ridesourcing, carsharing, and bikesharing users. Literature on microtransit users was not found.
Research firm 7ParkData reports that by the end of 2016, 13-to-15 million US adults would have used a “ridesharing” service, but suggests that Uber and Lyft may be close to saturating the major US markets for this service.120 Two national polls shed light on how people in the United States have used ridesourcing services: a June 2015 Morning Consult poll that surveyed approximately 2,200 individuals, and a 2016 Pew Research study that surveyed nearly 4,800 individuals.121
A 2014 ridesourcing study conducted by Rayle et al. included a survey (intercept and online) of 380 ridesourcing passengers in San Francisco, and found that ridesourcing users tend to be younger and more educated.131 Of the respondents, nearly three quarters (73 percent) were younger than 35, though this age group makes up only 33 percent of San Francisco’s population. Eighty-four percent of respondents had a bachelor’s degree or higher, more than the San Francisco population. The income levels of respondents varied, and were similar to the income profile of San Franciscans overall, although approximately 12 percent of those surveyed did not reply to the income-related question.
Studies from the mid-2000s and earlier indicate that carsharing members tend to be between the ages of 25 and 45, predominantly white, and well-educated; have higher-than- average incomes; and come from small households.132 Findings from subsequent studies support these trends. A 2008 survey of carsharing users in North America found that approximately 67 percent of US respondents were between 20 and 40 years of age, with 37.6 percent in the 20-to-30 year-old group. 133 Eighty-four percent of US survey respondents had a bachelor’s degree or higher level of education. Thirty-four percent of respondents reported incomes less than $50,000, another 34 percent reported incomes between $50,000 and $100,000, and another 23 percent reported incomes greater than $100,000. 134 Research on vehicles owned by carsharing members in the US and Canada found that in the US the average number of household vehicles prior to carsharing was 0.55, indicating that many member households may have been carless prior to joining carsharing.135
Round-trip carsharing is the oldest carsharing business model, so the majority of existing research likely reflects the characteristics of people using this specific service; less information is available about the users of other forms of carsharing. Some early research findings on peer-to-peer carsharing in Portland, Oregon suggest that this model may offer new mobility options for lower-income households. 136
A recent review of bikesharing literature reports that it is more probable that bikeshare users would be white (in the US and London) and male, and have higher-than-average incomes and levels of education. 137 Survey results of users of NiceRide Bikeshare (in Minneapolis/St. Paul, Minnesota (the Twin Cities)) 138 and Capital Bikeshare (CaBi, in the Washington, DC metro area) 139 report similar findings with respect to race, income, and education level; they also show that users skew younger than the general population. The NiceRide survey found that nearly 60 percent of survey respondents were between the ages of 25 and 44, skewing younger than the overall population, while 43 percent of short-term CaBi users and 55 percent of CaBi members were between the ages of 25 and 34.
Many bikesharing services are available to members and casual users (defined as those with bikeshare memberships of 30 days or less), the latter of which comprised about 86 percent of all bikeshare users in North America during the 2012 season. 140 Casual users often account for the greatest revenue in bikesharing systems, while members account for the greatest ridership. 141 Survey research on Bay Area Bike Share (San Francisco Bay Area) users in 2014 found that casual users tended to have race, education, age, and income characteristics similar to those of annual members.142 Some distinctions between the two groups were that casual users appeared to skew somewhat younger than annual members did, and the research team reported, “the income distribution of casual users is slightly more spread over lower-income brackets compared to annual members.” 143
The sections below provide information on ridesourcing, carsharing, and bikesharing trips. Literature on microtransit trips was not found.
Based on existing literature, the primary use of ridesourcing services appears to be for social and leisure trips. The SUMC found that more than half of survey respondents had used ridesourcing for a recreational or social trip within the last three months, and that ridesourcing was the top shared-use mode for recreational and social trips. 144 Rayle et al. found that the majority of reported trips in their San Francisco-based study were for social and leisure purposes (67 percent), although they acknowledge that they likely oversampled leisure trips and probably undersampled other trip types. 145
Trips for other purposes appear to make up a smaller share of trips made via ridesourcing. The SUMC found that only 21 percent of survey respondents had used ridesourcing for commuting, and 16 percent used it for shopping or errands.146 Similarly, Rayle et al. found that 16 percent of reported ridesourcing trips were for travel to or from work, four percent were to or from the airport, and 10 percent were for some other purpose.147 They also found that a large share of trips (47 percent) began somewhere other than home or work, while 40 percent were home-based. The SUMC suggests that with respect to commuting, people use ridesourcing on a situational basis—to fill in gaps or deal with special circumstances—rather than make it the core of their commute. 148 As evidence, they point to how recently people who use ridesourcing to commute have used various modes. Of survey respondents who used ridesourcing for commuting (21 percent of all respondents), 38 percent said that they last rode on a bus or train “today or yesterday,” while about 25 percent of that group said they last used ridesourcing ”today or yesterday.” 149 Meanwhile, 18 percent of people who use ridesourcing to commute said that their most recent ride on transit took place within the last week, compared to 37 percent who said that their most recent ridesourcing trip took place in the past week.
Lyft funded an independent survey of 5,700 Lyft passengers and 2,600 drivers in seven US cities, including Boston, between November 2014 and February 2015. According to the responses, which were analyzed by the Land Econ Group, 38 percent of passengers use Lyft to commute, 42 percent use it to visit family and friends, and 36 percent use it to run errands. 150 While this survey suggests that more people have used ridesourcing for errands or commutes than do the TCRP or Rayle surveys, the survey focused specifically on Lyft users, and the report citing these statistics did not specify how frequently Lyft passengers used the service for various trip purposes.
Many ridesourcing trips appear to be made late at night and on weekends. Rayle et al. report that about half (48 percent) of the surveyed trips occurred on a Friday or Saturday, and, though the survey captured trips throughout the day and night, the evening hours were heavily represented. 151 Bialik, Fischer-Baum, and Mehta looked specifically at taxi and Uber trips in New York City (NYC) on non-holiday weekdays, and report that the total number of pickups for both taxis and Uber rose during the evening rush period from 4:00 to 7:00 PM and again from 9:00 PM to 1:00 AM. 152
The SUMC found that ridesourcing was the top choice among the shared-use modes and transit for travel in the evenings or late at night, while it was the least frequent choice for travel during the morning rush period, evening rush period, and mid-day, as well as for travel on weekdays overall. 153 They examined demand for ridesourcing over the course of weekend and weekday periods, using the mean price (“surge”) multiplier, which reflects relative demand for ridesourcing trips at particular times and locations, as a metric. The SUMC team found that there is a clear peak in ridesourcing use between 10:00 PM and 4:00 AM on weekends, “when scheduled public transit capacity is at its lowest points and average headways are longest.” 154 Their results do identify peaks in demand during the weekday morning rush period, and increases in demand during weekend mornings and afternoons in a few cities, as shown in Figure 4-5.
FIGURE 4-1
SUMC Findings on Ridesourcing Demand on Weekdays
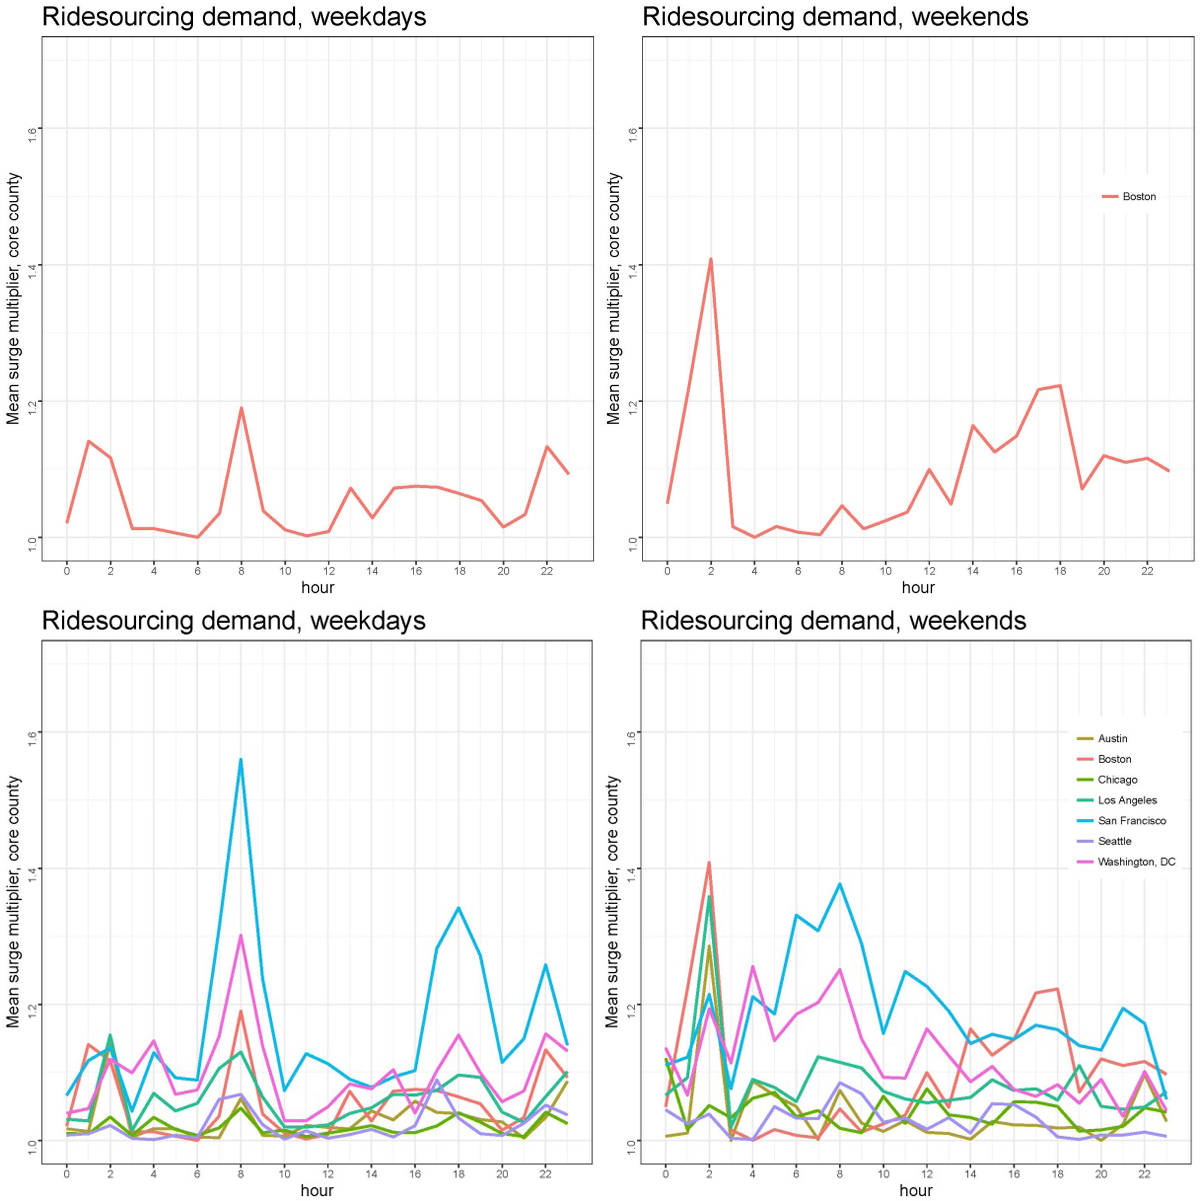
Figure Source: Shared-Use Mobility Center, TCRP Research Report 188 155
Note: Demand is measured using the mean surge multiplier, which reflects relative demand for ridesourcing trips at particular times and locations.
Rayle et al. found that the top reasons surveyed San Franciscans chose ridesourcing to travel were the “ease of payment,” the “short wait time,” and because ridesourcing was “the fastest way to get there.”156 Of the San Francisco ridesourcing passengers they surveyed, 92 percent still would have made their trip if ridesourcing were not available.157 Thirty-nine percent of these individuals would have taken a taxi, 33 percent would have taken transit (bus or rail), eight percent would have walked, and six percent would have driven. Rayle et al. suggest that the estimated eight percent of riders who would not have otherwise made their trip may underestimate the possible induced demand effect of ridesourcing, because their study may not have captured how respondents subconsciously decide whether a destination or neighborhood is accessible, based on taxi, transit, or parking access.158 Lyft also has provided information suggesting an induced-demand effect; the company reports that 54 percent of respondents to its seven-city survey said that Lyft enables them to get to places that are otherwise inaccessible, and 73 percent of passengers go out more frequently and/or stay out longer because of Lyft.159 The Pew Research Center study found that 86 percent of ridesourcing users agree with the statement that the service saves them time and stress. 160 Seventy-seven percent of frequent ridesourcing users agreed with the statement that these services “are more reliable than taking a taxi or public transportation,” compared to 57 percent of those who take ride-hailing services less frequently.161 The research team found that views on this question were consistent regardless of whether they themselves used taxis or public transit.
Millard-Ball’s 2005 carsharing study, which included a survey of more than 1,300 carsharing users in the US, found that recreation, social, shopping, and personal business trips are among the top trip purposes for carsharing.162 Approximately 21 percent of respondents reported having used carsharing for a work-related trip, though only 5.5 percent reported having used carsharing to travel to or from work. The small cohort that used carsharing to commute reported making about three carsharing trips per month. Overall, survey respondents reported making 3.34 trips per month using carsharing.
Studies using carsharing survey data from Washington, DC and Denver report similar findings in terms of trip purpose.163 A third of members in Denver indicated that they used carsharing for commuting, attending sporting events, and making personal errands at least once a month, with 20 percent of members reporting that they used carsharing to commute between one-and-three times per month. 164 Shopping’s high rank among carsharing trip purposes relates to the top reasons that people use carsharing vehicles for certain trips: having things to carry, needing a car to reach a destination, or needing to make multiple stops.165
The share of trips that carsharing users make for each purpose may vary by carsharing model (round trip versus one-way), although more research is needed in this area. Studies documenting one-way carsharing use in Seattle and Vancouver suggest that entertainment is one of the top purposes for one-way trips, but that commuting to work was also a common trip purpose.166 In the Boston area, Zipcar has reported that one of the most popular trips—based on the ONE>WAY program’s crowdsourcing survey tool—is between Downtown Boston and Logan Airport.167
The 2008 Washington, DC-area carsharing study found that carsharing trips were concentrated on weekend days.168 The SUMC found greater use of carsharing on weekends169 , and Kim’s 2015 study of carsharing in New York City provides additional support for the predominance of weekend use: the mean vehicle utilization rate for Zipcars in NYC on weekends was approximately 97 percent, compared to 70 percent on weekdays and 67 percent on weeknights.170 The DC-area study also found carsharing pick-ups most frequently occurred in the late morning to midday hours, and that the largest share of carsharing trips (36 percent) were completed in three-to-four hours. 171 The SUMC found slightly different results: carsharing use seemed to increase gradually over the course of the day, peaking in the evening (between 8:00 and 10:00 PM). 172
In his analysis of US and international bikeshare systems, Fishman found that the most common trip purpose among bikeshare members was commuting, while casual users reported using bikesharing for social or leisure trips.173 Buck et al. found similar results in their study of CaBi in Washington, DC, with casual members reporting 53 percent of their trips for tourism, and annual members reporting that 44 percent of their trips were for personal reasons, and 43 percent of trips were for work. 174 A separate review of CaBi activity found that bikeshare survey respondents use the service primarily for personal, non-work trips, such as entertainment, errands, and personal appointments.175 However, nearly 60 percent of respondents said that they used bikesharing to get to work at least occasionally, with 40 percent doing so often, although many of these individuals also identified transit as their primary commute mode. This study team suggests that these respondents may use bikeshare to connect to buses or trains.176
Bikeshare systems generally share a common daily usage profile, with weekday use peaking between 7:00 and 9:00 AM and again between 4:00 and 6:00 PM, and weekend use at its highest in the middle of the day.177 Research using data from multiple cities shows that trip length typically falls between 16-and-22 minutes, although trip lengths may vary by user type (casual user versus member) or season.178 The SUMC identified higher rates of bikesharing during afternoons and weekends.179
Casual users of the Bay Area Bike Share system reported choosing to use the service primarily for convenience (71 percent), followed by “faster mobility” (54 percent).180 In a 2013 study of CaBi, 69 percent of respondents said that a top reason they chose to become members was to “get around more easily, faster, shorter,” while 51 percent joined to have access to “a new travel option/one-way travel option.”181 Among members who used the service frequently, bikesharing was valued as a way to save money.182
The SUMC’s research analysis for APTA and TCRP focused specifically on opportunities and challenges for public transportation with respect to “technology-enabled mobility services”—ridesourcing, carsharing, and bikesharing—though their research also examined the impacts of these services on vehicle ownership and travel by car. 183 As discussed above, the majority of survey respondents identified transit as their most-commonly used shared-use mode, even among those who have used several shared modes for a variety of trip purposes. These results suggest the potential for reduced private-vehicle ownership among shared-use mobility service users. Survey respondents who had experience with transit had an average of only 1.5 cars per household; those with experience with shared-use modes in addition to transit had approximately 1.05 cars per household; and supersharers (who have used multiple shared-use mobility services) had an average of 0.72 vehicles per household. 184 Thirty-five percent of survey respondents (37 percent of supersharers) drove a car to work less often than prior to using shared modes, and 32 percent of survey respondents (37 percent of supersharers) drove a car for errands or recreational trips less often than prior to using shared modes. 185 Twenty percent of respondents using shared-modes reported they had postponed buying a car; 18 percent decided not to purchase one; and 21 percent sold a car and did not replace it. 186 These proportions all were higher among the supersharers group.
In their research for APTA and TCRP, the SUMC research team reports that shared-use modes generally complement public transit, although on some routes and at certain times of day, these modes may compete with transit service. 187 The team found that while “transit forms the backbone of all respondents’ mobility picture” for commuting, errands, and recreational trips, a five-to-ten percent larger proportion of supersharers used transit compared to the overall respondent group. 188 Forty-three percent of all respondents (42 percent of supersharers) reported using transit more frequently after they started to use shared-use modes; by comparison, 28 percent of all respondents (32 percent of supersharers) reported using transit less often after this change. 189 The research team suggests that respondents use different modes to fill specific mobility needs; for example, carsharing is used for errands and off-peak trips to areas without good transit access, while bikeshare is used during peak hours as an alternative to crowded transit service and to make last-mile connections. 190
As part of continued research into the relationship between shared-use mobility and transit services, the US DOT has established programs and awarded grants to explore and evaluate the potential impacts of shared-use mobility services on transportation systems around the country. As part of the Advanced Transportation and Congestion Management Technologies Deployment program, the federal government granted the Texas Department of Transportation nearly $9 million to provide a range of mobility options—including shared-use electric bicycles (“ebikes”) and social carpooling—to commuters, and to support unified payment across transit and other shared-use services.191 Further, the Federal Transit Administration has established the Mobility on Demand Sandbox program, which awarded nearly $8 million in 2016 to 11 projects focused on deploying, demonstrating, and evaluating on-demand concepts in transit. 192 Many of these projects concentrated on creating platforms that support multi-modal trip planning and, in some cases, integrated payment formats.
Because ridesourcing services are relatively new, there is limited information about how they affect users’ driving patterns or the number of vehicles they own. Existing research suggests that these services may help to reduce the amount of time that people drive in personally owned vehicles, and possibly even to avoid future vehicle purchases, although it may be too early to evaluate whether ridesourcing would have an actual impact on vehicle-ownership decisions.
The Pew Research Center found that of those who use ridesourcing on a daily or weekly basis, only 63 percent drove a car daily or weekly, compared to those who used the service less frequently (85 percent) or non-users (84 percent). 193 The team also found that of those who used ridesourcing daily or weekly, 64 percent owned a personal vehicle, compared to 78 percent in the less-frequent user or non-user groups. 194 Lyft states that 60 percent of surveyed passengers reported driving less because they had access to Lyft, and 46 percent said that they avoid owning a car because of the service. 195 Rayle et al. found that 43 percent of riders who participated in their San Francisco-area study did not own a vehicle. 196 Of those that did have a vehicle, 90 percent reported that they had not changed their vehicle-ownership status since they began using ridesourcing services.197 The study participants that did make changes in auto ownership indicated it was as likely that they would own more cars as it was that they would reduce their number of vehicles, suggesting that ridesourcing did not have an impact on their decisions. Most respondents to the Rayle et al. survey who owned a car reported that they drove about the same amount as before they started using ridesourcing, although 40 percent of vehicle owners surveyed said they drove less than before.198
However, this current research on ridesourcing’s effect on vehicle ownership and driving habits only captures the passenger side. In order to perceive ridesourcing’s effect on transportation more fully, we need increased research from the perspective of the services’ drivers. Once we can determine how much more TNC drivers are traveling in their personal vehicles to serve customers, and whether this work is changing their own vehicle-ownership patterns, then we can understand whether the combined activity of riders and drivers is creating a net increase or decrease in vehicle-miles-traveled (VMT) or trips, among other considerations.
Ridesourcing companies have emphasized the ways that their services connect to transit. Lyft reports that 25 percent of its riders use its service to connect to public transit.199 In its Friends with Transit campaign, launched in late 2015, Lyft reported that 33 percent of rides in Boston began or ended at transit stations, compared to 37 percent in New York City, 25 percent in Chicago, 20 percent in Washington, DC, and 24 percent in San Francisco.200 Individual transit stations are among the top destinations in many cities. The company reports that South Station is the second most popular Lyft destination in Boston, while seven of the top-20 most popular Lyft destinations in SF are transit stations. Lyft also highlights the ways that it may complement transit, such as by serving areas with limited transit accessibility or during late-night hours.
Uber also has publicized the number of stops that started or ended near transit stations in individual US cities. Uber researchers analyzed a month’s worth of data from 2016 and found that of all uberX trips in the Boston area, approximately 41 started or ended within one-eighth mile of a transit station (excluding any trips that both started and ended near transit stations).201 Uber also reports that 23 percent of trips in New Jersey began or ended within one-eighth mile of a transit station in September 2015, and trips that begin or end within one-eighth mile of a Metro-North station account for 29 percent of all rides in Connecticut.202 However, neither Uber nor Lyft report on changes in transit ridership with respect to ridesourcing trips that begin or end near transit stations. 203
Ridesourcing companies also are either forming or exploring various types of relationships with transit agencies in cities around the country. Some agencies have included connections to ridesourcing applications in their own smartphone applications. Several transit apps, such as those offered by Dallas Area Rapid Transit (DART)204 and the Metropolitan Atlanta Rapid Transit Authority (MARTA) 205 connect users to ridesourcing apps, while the TriMet Tickets app (for the Portland, Oregon area) now enables users to book Lyft rides or reserve car2go vehicles.206 Applications created by third-party developers, such as TransLoc and Xerox, also help connect transit customers to these services in Los Angeles, Memphis, and Raleigh-Durham, NC.207 Other partnerships between transit agencies and ridesourcing companies focus on subsidizing or reimbursing ridesourcing trips to complement existing transit service. For example:
Other agencies are evaluating the potential to use ridesourcing companies for paratransit services, with the hope of reducing costs and increasing convenience for customers. A key example is a 2016 MBTA pilot program that subsidizes Uber and Lyft trips as an alternative to THE RIDE paratransit service.211 This pilot initially enabled THE RIDE customers to use subsidized taxis, and later was expanded to include the ridesourcing companies.
The Wednesday, March 16, 2016 Metro shutdown in the Washington, DC area evinced how people may turn to ridesourcing to deal with service disruptions. The Washington Business Journal reported that Lyft saw a 65 percent increase in ridership during the morning commute compared to the previous Wednesday. 212 Meanwhile, Uber customer sign-ups increased by 70 percent during a 24-hour period, including that morning’s rush hour, compared to the same 24-hour period of the previous week.213 Because the Metro shutdown was announced on the afternoon of Tuesday, March 15, many of these new sign-ups likely can be attributed to the shutdown.214 After an earlier Metro tunnel fire disrupted service on three lines, Uber reported that it transported thousands of riders within DC and Virginia, with almost 20 percent of users taking its lower-cost uberPOOL service.215 This trend could be argued as complementary, with riders tapping into a shared-mobility ecosystem when transit systems need maintenance or cannot provide service.
Academic and policy research on how ridesourcing may support or compete with transit is becoming available. Past academic research on taxis—which is similar to ridesourcing—evinces that taxis can both compliment and substitute for transit. Columbia professor David King identified geographical asymmetries in the origins and destinations of taxi trips in New York, which indicates that people use taxis for only one leg of their daily round trips, with transit likely serving the other leg. 216 Meanwhile, Austin and Zegras found that in Boston, taxi trip-generation rates generally decrease near the MBTA’s Red, Orange, and Blue line stations and in areas with higher-frequency bus routes, while rates increase close to Green and Silver Line stations and in areas with many bus routes (all types).217 They suggest that variations in speed and service level across transit modes (such as heavy rail versus at-grade light rail) may contribute to these variations in nearby taxi demand.218
The SUMC research team found that those who frequently use ridesourcing for shared-use travel generally turn to automobile-oriented alternatives when ridesourcing is not available.219 They also note that the times when ridesourcing is popular—late night and weekends—are the same times when transit service is less frequent. Based on their findings, they suggest that ridesourcing is largely not chosen as a substitute for transit, but rather as a substitute for private auto trips or taxi rides.220 Meanwhile, the Pew Research Center found that those who used ridesourcing on a daily or weekly basis likely also would take public transit daily or weekly (56 percent), compared to less frequent users (19 percent) or non-users (9 percent).221
Research conducted by FiveThirtyEight analysts using New York City ridesourcing, taxi, and transit data suggests a complementary relationship between for-hire vehicles (ridesourcing and taxis) and public transit.222 They found that in Census tracts that have no nearby subway lines, taxis are used only 27 percent as often, and Uber 36 percent as often, as in NYC overall. Use of for-hire vehicles is noticeably higher in Census tracts with one subway line, and continues to increase as the number of subway lines in the tract increases. This is the case until a tract has 10 or more subway lines, at which point use of Uber begins to level off and use of taxis begins to decline. The FiveThirtyEight analysts suggest that one possible reason for this relationship is that personal vehicles may be the dominant mode of transportation in neighborhoods where public transit is limited, while people in transit-rich neighborhoods may use a mix of alternatives to get around. The FiveThirtyEight team also compared various scenarios of Uber and public transit trips, citing how they might compare to the cost of owning a car. They found that, given the prices for Uber and public transit and an estimated 2,000 trips per household per year, a household can make as much as 15 percent of its trips by Uber, and the combination of Uber and public transit would remain cheaper than owning a car. The team reports that “there’s a long way to go before Uber becomes cost-competitive with car ownership without an assist from public transit,” suggesting that these two services may be complements for those who do not want to purchase a car or travel by private vehicle.223
Based on their survey research in San Francisco, Rayle et al. report “that ridesourcing both complements and competes with public transit, at least with respect to individual trips.”224 When asked how they would have otherwise made their trip if ridesourcing were not available, 33 percent of respondents said they would have used transit. The top reason for choosing ridesourcing among those who would have otherwise used transit was that “it was the fastest way to get there.”225 Using the Google Map Directions application program interface (API), the research team found that the majority of trips were accessible by transit, but 86 percent of trips would have been at least 50 percent longer by public transit, and two-thirds would have been twice as long.
In summary, there appears to be some evidence for a complementary relationship between ridesourcing—particularly sequential ridesourcing—and transit, given the frequency and circumstances of when people use ridesourcing. However, more research is needed to determine the strength of this relationship. One topic in particular that merits further research is the types of transit trips that ridesourcing may be replacing, in terms of trip length, crowding, or number of transfers.
The previous section discusses ridesourcing in general, and likely captures more of the characteristics of sequential ridesourcing services (which are more established and operate more like taxis) than of concurrent ridesourcing services. Concurrent ridesourcing services, like uberPOOL and Lyft Line, operate more like transit services than their sequential counterparts do. They match riders with similar origins and destinations, but unlike fixed-route transit services, their routes adjust dynamically as drivers accept additional passenger requests in real time. 226 Ridesourcing passengers can receive discounted fares for taking uberPOOL or Lyft Line.227 The SUMC proposes that ridesourcing companies may be uniquely capable of making tech-enabled ridesharing a reality, given their large networks of drivers and passengers and their keen brand awareness and marketing savvy.228
Meanwhile, microtransit systems—such as Bridj in Boston, Via in New York, and Chariot in San Francisco—have also been perceived as more direct competitors to transit, compared to sequential ridesourcing. CityLab reporter Eric Jaffe notes that microtransit services potentially could benefit transit by providing feeder service to transit trunk lines, but notes that it also could siphon off existing transit riders from high-density corridors.229 These services might increase ridership by encouraging affinity groups to ride together, but they might also support the development of a “two-tiered” transportation system, with public transit serving those who cannot afford expensive private services. 230 Transportation researcher Susan Shaheen has expressed some skepticism about the role of microtransit in supporting transit, noting that it could provide some complementary services, including for transit lines where demand exceeds capacity, but that it has a history of being a direct competitor.231
Available data on microtransit and concurrent ridesourcing primarily comes from the companies themselves. In terms of volumes, in October 2015, Uber said that about 10,000 San Franciscans regularly use its uberPOOL shared-ride service during commuting hours (defined as 7:00 to 10:00 AM and 5:00 to 8:00 PM, Monday through Friday); and that the most popular time for uberPOOL requests in San Francisco was on weeknights around 6:00 PM.232 In February 2016, Uber reported that uberPOOL made up approximately half of the Uber rides in San Francisco.233 Lyft reported in 2015 that Lyft Line already accounted for more than half of Lyft rides in San Francisco, with high matching rates for riders at rail stations, and noted that the service is growing in Los Angeles, Austin, and New York City.234 As of July 2015, Lyft reported that 20 percent of its Lyft Line rides in San Francisco were triples, where three or more parties overlap on one ride.235 With respect to microtransit, Chariot, which offers commuter service on crowdsourced routes in San Francisco, reported providing more than 11,000 rides per week in November 2015, and that it hit 50,000 rides per month as of January 2016.236
The relative newness of concurrent ridesourcing and microtransit, combined with the closely guarded nature of their data, means that many aspects of these services and their impacts remain unknown. Some information is available: for example, Chariot reports that one in five riders use the service to get to or from a BART or Caltrain station.237 Some microtransit service providers have identified themselves as complements to existing fixed-route transit services. For example, Ali Vahabzadeh, Chariot’s chief executive officer (CEO), said that the company “wants to provide more supply of fast transit where there is a lot of demand, and also to provide mass transit where it really doesn’t exist in the first place.”238 OurBus CEO, Mike Virdi, has similarly argued that if private providers can operate service on low-demand routes, transit agencies can divert resources to where improvements are most needed.239 With respect to concurrent ridesourcing, Uber reports that in the Boston area, approximately 42 percent of uberPOOL trips start or end within one-eighth mile of a transit station (excluding trips that both start and end near transit stations).240 Uber has also suggested that in the case of late-night service, the presence of multiple options makes the whole system work more efficiently.241 The company explained that when the MBTA provides a reliable option, then Uber demand decreases, reducing the price of a ride for those who choose to take Uber.
Several microtransit service providers, including Bridj and Chariot, have become members of APTA.242 Bridj also expressed interest in working with the MBTA to provide late-night service after the MBTA canceled its fixed-route late-night operations.243 On the concurrent ridesourcing front, Uber expanded its uberPOOL coverage area in metropolitan Washington, DC in advance of the one-day Metro shutdown in March 2016, and saw a 140 percent increase in uberPOOL riders overall, with high demand along routes typically served by rapid transit.244
In Kansas City, a low-density metro area where only about one percent of the population uses public transportation to get to work, a transit authority and a microtransit company have created a formal partnership.245 In 2016, Bridj and the Kansas City Area Transportation Authority (KCATA) formed a public-private partnership to launch KC Bridj.246 This one-year pilot will serve locations that include bus stops and areas served by existing Kansas City transit and bike-share systems; additional routes will be added in response to rider demand. Rides through the service cost $1.50, and the city offered 10 free rides as part of a promotion.247 The city is contributing approximately $1.3 million from sales taxes to the initiative.
Other business practices and research findings highlight the potential for microtransit to compete with existing fixed-route transit. Both Uber and Lyft have tested monthly pass options for their concurrent ridesourcing services. 248 Bridj and Chariot serve high-demand commuting routes from wealthy residential neighborhoods to downtown areas; this creates the potential for them to draw high-income passengers from fixed-route transit.249 These routes likely would be more attractive to a private transit operator than feeder routes, which often can be less profitable.250 Existing information on Bridj operations in the Boston area suggests that the majority of Bridj customers have previously used fixed route transit. Bridj customer sign-up surveys, collected between January and December 2014, reported that 17 percent of passengers previously traveled from their origin to their destination by driving; 61 percent previously used public transit; 20 percent walked or biked; and two percent of riders traveled in some other way.251
Bridj CEO, Matthew George, has reported that approximately about 20 to 30 percent of riders in the Boston area are new to mass transit, which suggests that the remaining 70 to 80 percent have used transit before.252 In a report to the Cambridge License Commission on a six-month pilot program for Bridj operations, Bridj reported only about 30 percent of riders used the service to make two-way trips, suggesting that people may use it under specific circumstances, instead of for regular commutes. However, without information on Bridj ridership numbers or frequency of use, the impact that Bridj might have on the MBTA remains unclear.253
Concurrent ridesourcing has undergone rapid expansion since it first emerged in 2014. As of April 2016, Lyft Line is available in 15 US markets, while uberPOOL is available in 29 cities.254 Meanwhile, microtransit services are still relatively few, and the foothold that microtransit may continue to have in the shared-use mobility realm is unclear. These services share many features in common with Kutsuplus, a Helsinki-based “mobility-on-demand” program that used 15 roaming mini-buses to provide downtown transit service. The routes of these shuttles would dynamically change based on new passenger requests. The service, which began in a test phase in 2012 and expanded to the public in 2013, ended in December 2015. Some have speculated that the service ended because there were insufficient vehicles available during the initial rollout, and trips required large public subsidies; others blame the economy. 255 Columbia University professor David King, who studies similar transportation services, notes that services similar to Kutsuplus face the same issue of the difficulty of becoming large enough to succeed.256
As with data about how these services interact with fixed-route transit, there is very limited information concerning the impacts of microtransit and concurrent ridesourcing on private-vehicle travel and ownership. In a report to the Cambridge License Commission on a six-month pilot program for Bridj operations, Bridj estimated that 20 to 25 percent of their current riders take Bridj instead of driving in Cambridge, resulting in 25 to 30 car trips being removed from Cambridge streets each week.257 Uber has highlighted the potential VMT reduction benefits of its uberPOOL service, estimating that it saved San Francisco passengers about 674,000 miles of travel, compared to the sum of individual rider routes, between February 20 and March 20, 2015.258
Martin et al. researched vehicle ownership using the 2008 North American carsharing survey, and identified a statistically significant drop in vehicle holdings among carsharing members.259 Before they joined a carsharing service, 60 percent of these households were carless, while 31 percent owned only one car. After joining carsharing, 80 percent of households in the sample were carless, a shift that was driven by one-car households becoming carless households. Based on these results, the research team estimated that between 9 to 13 vehicles are removed from the road per carsharing vehicle, a widely cited statistic in carsharing literature and promotional materials.260 These results are similar to findings in previous research studies, although these earlier studies yield results ranging from 4.6 to 20 cars reduced per carsharing vehicle.261
Shaheen et al.’s retrospective of the carsharing industry, published in 2009, reported that results from US and Canadian carsharing organizations show that 15 to 32 percent of carsharing members sold their personal vehicles, and between 25 and 71 percent of members avoided an auto purchase because of carsharing. 262 Using results of a 2014–15 survey of car2go members in five North American cities, Martin and Shaheen estimate that between two and five percent of members who used car2go more than once a month sold a vehicle because of car2go, and that another seven to 10 percent suppressed (or avoided) a vehicle purchase because of car2go.263 The car2go service operates on a free-floating carsharing model that enables users to park carsharing vehicles anywhere within a defined geographic area, as opposed to in assigned spaces.
Both past and recent studies show declines in VMT or vehicle kilometers traveled (VKT) by carsharing users. In their 2009 retrospective, Shaheen et al. calculated a 44 percent average VMT/VKT reduction per carsharing user, although they identified a 7.6 to 79.8 percent range in reductions across the US, likely because of variations in member use and survey design.264 Studies vary in terms of the metrics they use to report changes in driving and VMT. A 2013 Denver study found 33 percent of carsharing households reported reducing their household vehicle mileage, while another 11 percent reported increasing it. 265 However, when asked about changes in overall mode use, 40 percent of people reported driving alone less after joining a carsharing program, while only three percent reported driving alone more. 266 Shaheen and Martin estimate that in cities with car2go, households VMT reductions range from six (in Calgary) to 16 percent (in Washington DC and Vancouver) on average. These reductions include assumptions about vehicle miles that were suppressed because car2go members did not purchase new vehicles. 267In metro Washington DC, a 2008 survey found that 42 percent of carsharing members drove more than 5,000 miles per year before joining carsharing, but only 28 percent drove this much after joining carsharing.268 Meanwhile 20 percent drove less than 2,500 miles per year before joining carsharing, while 36 percent drove less than 2,500 miles per year after joining carsharing.
Carsharing is an older shared-use mode than other modes discussed in this report, so it has a longer history of formal partnerships with transit. In 2002, Zipcar partnered with the MBTA, one of the first transit agencies in the country to house vehicles at various transit stations throughout its service area.269 Zipcar has since formed partnerships with agencies including the Bay Area Rapid Transit District, New York’s Metropolitan Transit Authority (MTA), and Washington, DC’s Metropolitan Transit Authority (WMATA) and District Department of Transportation (DDOT). Some carsharing-and-transit partnerships, such as those in Portland and Los Angeles, are similar to Zipcar’s partnership with the MBTA, which includes making carsharing vehicle spaces available at transit stations. 270 Chicago features an alternative: In 2009, I-Go Carsharing and the Chicago Transit Authority partnered to offer a joint carsharing and public transit pass. However, few other North American shared-use mobility services have implemented similar programs because of a lack of incentives and institutional barriers. 271
Available information on the impacts of carsharing on transit is mixed. Based on its survey, the SUMC suggests that carsharing is used for errands and off-peak trips to locations that lack good transit access.272 Zipcar has cited supportive relationships between carsharing and transit. In 2007, the company reported that 96 percent of surveyed members in the Boston area regularly ride the MBTA, and that an increasing number of commuters were electing to take transit to work and use Zipcars during the day.273 Zipcar also reports that members of Zipcar and carsharing programs report a 46 percent increase in public transit trips, a 10 percent increase in bicycling trips, and a 26 percent increase in walking trips.274 In Washington, DC, 22 percent of members increased their weekly trips by bus or train after joining carsharing, while 11 percent decreased them.275
However, several studies show people using transit less after joining carsharing. The 2013 study of carsharing in Denver showed that 17 percent of people used transit less after joining carsharing, while 12 percent used it more. 276 In their research on car2go impacts, Martin and Shaheen found that in all five cities they studied (Calgary, Seattle, Toronto, Vancouver, and Washington DC) people had both increased and decreased their public transit usage. However, in all cities except Seattle, more people decreased than increased their transit use because of having access to car2go.277 In Seattle, six percent of survey respondents increased their rail use because of car2go, compared to three percent that decreased it.278 Meanwhile, survey results from both the Denver and Washington, DC studies reported increases in bicycling and walking after people joined carsharing.279
Shaheen and Martin’s 2011 study, which used data from the 2008 North American carsharing survey, highlights the complex relationship between carsharing and transit.280 Across the entire survey sample, they identified an overall decline in public transit usage that was statistically significant: For every five carsharing members that use rail less, four members use rail more, and for every 10 members that ride a bus less, almost nine members ride the bus more.281 They noted that the reduction in transit use was not uniform across all organizations, and that the people who decreased and increased their transit use are “fundamentally different in terms of how carsharing impacts their travel environment.”282 They suggest that carless households might use transit less once they join carsharing, while households that reduce their dependence on cars might use transit more.283 They also identified statistically significant increases in travel by walking, bicycling, carpooling, and overall reductions in auto commuting, reporting, “when these shifts are combined across modes, more people increased their overall public transit and non-motorized modal use after joining carsharing than decreased it.”284
Less information is available on formal partnerships between transit and bikesharing than for other shared-use modes, although Los Angeles Metro plans to implement its own bikeshare system, with more bikes clustered near transit hubs to support first-and-last mile connections.285 Research on the relationship between transit and bikesharing shows some cases where these modes support one another, but also that bikesharing frequently is used as a substitute for transit.
Researchers have offered several hypotheses to explain the relationship between bikeshare and transit. Shaheen et al. suggest that varying modal shifts in public transit likely are attributable to the differences in the public transit networks across the cities they studied.298 Public bikesharing may be taking riders off crowded buses in large cities, and improving access and egress on buses in smaller ones. Similarly, Ricci found that cases where bikesharers made behavioral shifts away from using transit were more common in dense, core urban areas, while cases where bikesharers made shifts toward using transit were more common in peripheral, low-density areas.299 In his review of bikeshare literature, Fishman notes the surprising finding that bikeshare members of the systems he studied did not use these systems frequently, and that a large share of each system’s members made one or even no trips in a given month.300 He suggests that this could be evidence that bikesharers may use the service as an adjunct to their regular modes of transportation.
Bikesharing appears to have more direct and desirable effects on driving and the use of personal vehicles than on transit. According to Shaheen, et al., 53 percent of bikesharers in the Twin Cities drove less often, compared to 29 percent in Montreal and 35 percent in Toronto, although the latter two cities had higher shares of people that did not drive before or after they began to use bikesharing.301 Thirty percent of CaBi users in Washington, DC reported driving less often since joining CaBi, while another 20 percent reported driving “much less often.”302 Similarly, 29 percent of CaBi users rode in taxis less frequently since joining CaBi, and another 31 percent used them much less often.303
Several studies examined how much bikesharers might have decreased their driving. Before joining Capital Area Bikeshare, CaBi survey respondents drove an average of 150 miles per month, or about 1,805 miles per year. Since joining the system, the average driving miles fell to about 134 per month, or 1,607 per year.304 Overall, 78 percent of respondents who reduced their driving miles indicated that bikesharing had been at least somewhat of a factor that contributed to their driving less.305 Fishman, Washington, and Haworth analyzed changes in vehicle-miles-traveled by car in a number of cities—Washington, DC, London, the Twin Cities, Melbourne, and Brisbane—and found that reductions in VMT are dependent upon the rates at which bikeshare trips are replacing vehicle trips. However, in US and Australian cities, the reduction in VMT was approximately twice the amount of new vehicle mileage necessary to rebalance the bikeshare systems.306
Less information is available about how bikesharing may affect the number of vehicles a household owns. Shaheen and Martin identified reductions in vehicle ownership ranging from 1.9 percent in the Twin Cities to 3.6 percent in Montreal.307 The CaBi survey found that 86 percent of respondents had not made any changes or considered making changes to their number of household vehicles, and only five percent sold a vehicle and did not replace it later.308 Of those that did sell vehicles, 81 percent said that their CaBi membership was a factor in the decision.309 Fifty percent of those that reduced their household vehicles reported that they now live in zero-vehicle households, while 33 percent shifted from a two-vehicle to a one-vehicle household.310
Highlights related to each of the literature review questions are listed below.
Studies that discuss whether bikesharing users reduce their number of household vehicles show that these changes are relatively minimal.
Part 5—Shared-Use Mobility Services and Public Policy
The rapid growth, change, and diversification of the shared-use mobility ecosystem have and continue to raise issues of concern for transportation policy makers. The previous sections discuss some of these, in particular the effects that shared-use mobility services may have on transit ridership, single-occupant vehicle (SOV) travel, and vehicle ownership. Table 5-1, below, and the sections that follow consider other issues, such as equity, disruption of the for-hire vehicle industry, congestion and land use, and competition for public funds.
TABLE 5-1
Public Policy Issues and Shared-Use Mobility Services
| Public Policy Issue |
|
Related Shared-Use Mode: Sequential Ridesourcing |
Related Shared-Use Mode: Microtransit |
Related Shared-Use Mode: Carsharing |
|
|---|---|---|---|---|---|
| Consumer Access to Smartphones and the Internet |
X |
X |
X |
X |
|
| Consumer Access to Bank Accounts |
X |
X |
X |
X |
|
| Consumer Access to Driver Licenses |
null |
null |
X |
null |
|
| Consumer Access to Information about Shared Mobility |
X |
X |
X |
X |
|
| Disparities in Service |
X |
X |
X |
X |
|
| Access to Services for People with Disabilities |
X |
X |
null |
null |
|
| Disruption of For-Hire Vehicle Industry |
X |
X |
null |
null |
|
| Employment Status of Drivers |
X |
X |
null |
null |
|
| Public Safety and Insurance |
X |
X |
X |
X |
|
| Land Use and Congestion |
X |
X |
X |
null |
|
| Competition for Public Sector Financial Resources |
X |
X |
X |
X |
|
| Service Integration |
X |
X |
X |
X |
|
| Autonomous Vehicles |
X |
X |
null |
null |
|
Source: Central Transportation Planning Staff.
As shared-use mobility services play larger and more diverse roles in transportation systems, they raise a host of equity issues with respect to who is served, where service is provided, and how social-service transportation obligations are met.
Shared-use mobility services may vary in terms of affordability. However, Section 4.1 of this report shows that many users of these services enjoy high household incomes. Differences in average household incomes across racial and ethnic groups may contribute to lower use of these services among nonwhite groups. 311 Potential shared-use mobility customers need not only to be able to pay these services’ fares and fees, but also to have access to other resources such as financial services and the internet, which raises the additional equity issues cited below.
Shared-use mobility companies may be able to address these barriers through subsidies, educational campaigns, and workarounds for application and payment processes. Some lower-income households may be able to access some shared-use mobility options more easily than others may. For example, research on peer-to-peer carsharing in San Francisco shows that neighborhoods with lower average incomes had high levels of peer-to-peer rental activity.319 Public partnerships can be a way to address some of these barriers. For example, the City of Boston and the Boston Public Health Commission offers $5 Hubway memberships to low-income Boston residents.320
Shared-use mobility service or infrastructure can vary by geographic location. For example, research in several US cities identified disparities in access based on race, education, and income in terms of location of bikeshare docking stations, with disadvantaged groups having less access.321 Private-sector services tend to arise and propagate where demand is greatest: generally dense, affluent areas of cities.322 The density of demand potentially affects both fixed-route and on-demand service. For example, microtransit trips that Bridj users may request through its app may not be fulfilled if there is insufficient demand. Service companies also may hesitate to put infrastructure in areas they perceive to be lacking in demand or where they perceive there will be risk of damage to assets or liability issues.323 In contrast, Hubway has recently opened 10 bicycle stations in Roxbury and Dorchester with support from the Barr Foundation—an example of a Boston-area shared-use mobility provider expanding service into traditionally underserved areas.324 In terms of discrimination based on race, Hughes and MacKenzie’s study of TNC wait times in Seattle found no relationship between wait times for an uberX and the proportion of minorities in a Census block group. 325 A study funded by Uber found that Uber had shorter wait times and was more reliable in low-income and minority neighborhoods than were taxis.326 However, a 2016 study of ridesourcing trips in Boston and Seattle found that African Americans in Seattle waited longer to have their ride request accepted.327 In Boston, UberX drivers were more prone to cancel rides for riders with “black-sounding names.”328 While the research team did not find a similar affect among Lyft riders, they noted that Lyft drivers could see passenger information prior to accepting a ride, unlike Uber.
Both Uber and Lyft have services that connect riders requesting wheelchair-accessible vehicles to local taxi services or other operators that provide wheelchair accessible rides; and some cities have access to UberASSIST services, where driver partners have been trained to assist to seniors and people with disabilities. Both companies are involved in an MBTA pilot to provide paratransit service, and have communicated with other transit agencies around the country regarding supporting paratransit service. 329 However, riders and advocates have expressed concerns about the availability of wheelchair accessible rides. 330 Many cities and taxi regulatory authorities have taken steps to encourage, mandate, and subsidize the availability of accessible taxis over time, and many transit services use taxis to transport people with disabilities.331 In spite of these requirements, the Transportation Research Board has found that the number of accessible cabs has always remained low across many jurisdictions.332 In places where ridesourcing demand is outpacing demand for taxis, taxi companies may become less able to provide accessible vehicles and service, which may restrict the mobility options of people with disabilities if ridesourcing companies are not providing alternatives.
Uber and Lyft have introduced features to meet the needs of people who are visually impaired or hard-of-hearing, as well as those who use mobility devices, and some argue that the use of smartphone apps to request and pay for trips may reduce discrimination, because drivers do not know whether a rider may be vision-impaired when they request a ride.333 However, lawsuits have been brought against both companies for Americans with Disabilities Act violations, including for refusing to pick up riders with service animals.334
Numerous policy issues have emerged as ridesourcing companies have disrupted existing for-hire vehicle markets and regulatory frameworks in the US and around the world. While historically taxis have provided a small share of trips overall, they also have filled important gaps when service cannot be provided by other modes.335 While TNCs provide service that is comparable to taxis, limousines, and sedans, they provide a number of additional features, including: 336
The Transportation Research Board report, “Between Public and Private Mobility:
Examining the Rise of Technology-Enabled Transportation Services,” offers extensive detail on many of the issues that currently affect the for-hire-vehicle industry, including:
California was the first state to establish TNC-specific regulations in 2013. Although a comprehensive clearinghouse of state and local ridesourcing regulations has yet to be developed, the Property Casualty Insurers Association of America reports that 40 states have enacted ridesourcing regulations, while another three have legislation in progress.343 Many states and localities have followed California’s approach, which entails imposing fewer fees and requirements on TNCs than on established taxi, limousine, and sedan companies. 344 Several cities, including Los Angeles, New York, and Chicago, have developed, tested, required, or otherwise made available e-hail taxi smartphone applications. Many localities also prohibit TNCs from serving the street-hail market. However, these provisions only address a few of the issues affecting the for-hire-vehicle industry, while many more will remain contentious for the foreseeable future.
Shared-use mobility services not only compete with transit for rider fares, but increasingly also compete for tax benefits and public funding. Bridj, Chariot, and Via riders are able to pay their fares with pre-tax commuter benefits, which enhances the ability of these companies to compete with fixed-route transit services. In August 2016, Wage Works, which administers consumer-directed benefits, announced it would allow participants to pay for UberPOOL rides with commuter benefit pre-tax funds.345 This option will be available in New York first, and later phased into other cities with UberPOOL. The proposed Bike to Work Act would amend the Internal Revenue Code to allow workers to use their pre-tax commuter benefits for bikeshare travel; and the proposed Bikeshare Transit Act would codify bikeshare as transit in federal law, which would make it eligible for various types of federal transportation improvement funding.346 Also, in cities like New York, where a portion of taxi surcharges support public transit, declining taxi use because of ridesourcing can lead to millions of dollars of lost public transit funding.347 New York State legislators have proposed a bill that would transfer a portion of the sales tax on ridesourcing trips to state transit agencies, with a percentage going to the New York City’s MTA.348
Passenger and driver safety and TNC driver background checks are topics that have received extensive media attention recently. However, other public policy issues related to safety and insurance also need to be addressed, such as:
Shared-use mobility services are generally dependent on land-use density to aggregate demand and make service convenient for potential customers; although they may be successful in areas that otherwise have good amenities and walkability, or when technology reduces the need for infrastructure (for example, dock less bikeshare systems).351 Ridesourcing, and perhaps even microtransit, may have the potential to alter land use patterns, either by adding travel options that encourage urban living and lower levels of household vehicle ownership, or by reducing the cost and increasing the convenience of travel in ways that promote sprawl.352 Increased or decreased VMT generated by shared-use mobility services, along with the use and turnover of various types of vehicle models, in turn affects energy consumption, and changes in greenhouse gas and other emissions. To understand the impacts of ridesourcing on the environment and climate better, University of California-Berkeley’s Transportation Sustainability Research Center is partnering with the Natural Resources Defense Council to study these issues.353
Ridesourcing and microtransit vehicles compete for street space with other vehicles, users, and activities, prompting concerns about congestion. The City of New York studied recently perceived drops in vehicles speeds in Manhattan’s central business district, and attributed these to a number of factors, including increased construction and delivery activity, population and job growth, and tourism.354 However, the city’s study noted that NYC buses typically use scarce urban street space much more efficiently than for-hire vehicles, including those carrying multiple passengers. Shared-use mobility services could also create more localized congestion if they are using bus stops and other spaces reserved for public transit to drop off and pick up passengers. The diversion of riders from transit to ridesourcing may also exacerbate congestion.355
To incorporate shared-use mobility into current and future transportation systems effectively, public agencies should also consider various opportunities and developments, such as the ones listed below:
1 Shaheen, S., et al, Shared Mobility: Definitions, Industry Developments, and Early Understanding, 2015, http://innovativemobility.org/wp-content/uploads/2015/11/SharedMobility_WhitePaper_FINAL.pdf, accessed April 19, 2016, p. 4.
2 Ibid.
3 Ibid.
4 Lagorio-Chafkin, C. “How Uber is going to hire 1,000 people this year.” January 15, 2014. Inc. http://www.inc.com/christine-lagorio/how-uber-hires.html, accessed January 27, 2017
5 Fishman, E., “Bikeshare: A Review of Recent Literature.” Transport Reviews 36 (2016):1, 92-113. http://dx.doi.org/10.1080/01441647.2015.1033036, accessed April 19, 2016, p. 92-94.
6 Shaheen, S. and M. Christensen, “Shared-Use Mobility Summit: Retrospective from North America’s first gathering on shared-use mobility,” 2014, http://tsrc.berkeley.edu/sites/default/files/Shared-Use%20Mobility%20Summit%20White%20Paper%201.pdf, accessed April 19, 2016, p. 9; Cooper, R. and V. Timmer, 2015. Local Governments and the Sharing Economy. http://www.localgovsharingecon.com/uploads/2/1/3/3/21333498/localgovsharingecon_report_full_oct2015.pdf, accessed April 19, 2016, p. 44; ITS America. Rise of the Real-time Traveler: An exploration of trends and innovation in urban mobility, 2015. http://www.trb.org/Main/Blurbs/173251.aspx, accessed January 7, 2017, p. 10.
7 PWC, “The sharing economy: How is it affecting you and your business?” http://www.pwc.co.uk/issues/megatrends/collisions/sharingeconomy.html, accessed April 19, 2016.
8 ITS America, Rise of the Real-time Traveler: An exploration of trends and innovation in urban mobility p. 2; Cooper, R., V. Timmer, Local Governments and the Sharing Economy, p. 7.
9 ITS America. Rise of the Real-time Traveler: An exploration of trends and innovation in urban mobility, p. 2; Cooper, R., V. Timmer, Local Governments and the Sharing Economy, p. 71.
10 Dutzik, T., et al., Millennials in Motion: Changing Travel Habits of Young Americans and the Implications for Public Policy, 2014, US PIRG Education Fund, Frontier Group. http://uspirg.org/sites/pirg/files/reports/Millennials%20in%20Motion%20USPIRG.pdf, accessed January 7, 2017, p. 9-13.
11 Giffe, C. et al., “The Changing Nature of Mobility,” Deloitte Review 15 (2014), 57-80. http://d27n205l7rookf.cloudfront.net/wp-content/uploads/2014/07/DR15_Changing_Nature_Of_Mobility.pdf, accessed April 19, 2016, p. 58, 67.
12 Giffe, C., “The Changing Nature of Mobility,” p. 67.
13 Committee for Review of Innovative Urban Mobility Services, Special Report 319: Between Public and Private Mobility: Examining the Rise of Technology-Enabled Transportation Services. 2015, Transportation Research Board, http://onlinepubs.trb.org/onlinepubs/sr/sr319.pdf, accessed April 19, 2016, p. 7-11; Committee for Review of Innovative Urban Mobility Services. Special Report 319: Between Public and Private Mobility: Examining the Rise of Technology-Enabled Transportation Services, Appendix A: Taxonomy of Established and Emerging Personal Transportation Services, 2015, Transportation Research Board, http://onlinepubs.trb.org/onlinepubs/sr/sr319AppendixA.pdf, accessed April 19, 2016, p. 1-3.
14 Smith, A., et al., The Smartphone Difference, 2015, Pew Research Center. http://www.pewinternet.org/2015/04/01/us-smartphone-use-in-2015/,accessed April 23, 2016, p. 6, 13, 22.
15 Ibid., p. 6.
16 Ibid.
17 Ibid, p. 22.
18 Shaheen, S., et al., Shared Mobility: Definitions, Industry Developments, and Early Understanding, p. 17; GlobeSherpa, “GlobeSherpa and RideScout Merge to Become Moovel,” April 16, 2016, Mass Transit, http://www.masstransitmag.com/press_release/12195354/globesherpa-and-ridescout-merge-to-become-moovel-north-america, accessed April 19, 2016.
19 Committee for Review of Innovative Urban Mobility Services. Special Report 319: Between Public and Private Mobility: Examining the Rise of Technology-Enabled Transportation Services, p. 105.
20 Nanos, J., “A baby sitter at the push of a button? Yes, and a ride for your kids, too,” March 27, 2016, The Boston Globe, https://www.bostonglobe.com/business/2016/03/27/baby-sitter-push-button-yes-and-ride-for-your-kids-too/Kgz3msMtrJXFUkKbXXuiHI/story.html, accessed April 19, 2016.
21 Kodransky, M., and G. Lewenstein, Connecting Low Income People to Opportunity with Shared Mobility, 2014, Institute for Transportation Development and Policy and Living Cities, https://www.itdp.org/wp-content/uploads/2014/10/Shared-Mobility_Full-Report.pdf, accessed April 19, 2016, p. 8-10.
22 ITS America, Rise of the Real-time Traveler: An exploration of trends and innovation in urban mobility, p. 12-13.
23 Shared Use Mobility Center, Shared-Use Mobility Reference Guide, 2015, http://sharedusemobilitycenter.org/wp-content/uploads/2015/09/SharedUseMobility_ReferenceGuide_09.25.2015.pdf, accessed January 7, 2017, p. 7, 9, 11.
24 Shaheen, S. and M. Christensen, “Shared-Use Mobility Summit: Retrospective from North America’s first gathering on shared-use mobility,” p. 2.
25 Committee for Review of Innovative Urban Mobility Services, Special Report 319: Between Public and Private Mobility: Examining the Rise of Technology-Enabled Transportation Services, p. 9-11; Committee for Review of Innovative Urban Mobility Services, Special Report 319: Between Public and Private Mobility: Examining the Rise of Technology-Enabled Transportation Services, Appendix A: Taxonomy of Established and Emerging Personal Transportation Services, p. 1-4, 10, 13.
26 Shaheen, S., et al., Shared Mobility: Definitions, Industry Developments, and Early Understanding, p. 11-13.
27 Cooper, R., and V. Timmer, Local Governments and the Sharing Economy, p.74, 86.
28 Shared Use Mobility Center, Shared-Use Mobility Reference Guide, p. 5-6.
29 Shaheen, S. and M. Christensen, “Shared-Use Mobility Summit: Retrospective from North America’s first gathering on shared-use mobility,” p. 7.
30 Committee for Review of Innovative Urban Mobility Services, Special Report 319: Between Public and Private Mobility: Examining the Rise of Technology-Enabled Transportation Services, Appendix A: Taxonomy of Established and Emerging Personal Transportation Services, p. 1-4, 1-8.
31 Shaheen, S., et al., Shared Mobility: Definitions, Industry Developments, and Early Understanding, p. 5-10.
32 Etherington, D., “GM’s Maven starts offering one-way car sharing.” September 26, 2016. Tech Crunch. https://techcrunch.com/2016/09/26/gms-maven-starts-offering-one-way-car-sharing/, accessed December 29, 2016.
33 Shared Use Mobility Center, Shared-Use Mobility Reference Guide. p. 4,6,11.
34 Shaheen, S. and M. Christensen. “Shared-Use Mobility Summit: Retrospective from North America’s first gathering on shared-use mobility,” p. 2.
35 Committee for Review of Innovative Urban Mobility Services, Special Report 319: Between Public and Private Mobility: Examining the Rise of Technology-Enabled Transportation Services, Appendix A: Taxonomy of Established and Emerging Personal Transportation Services. p. 1-3, 10, 14.
36 Kodransky, M., and G. Lewenstein, Connecting Low Income People to Opportunity with Shared Mobility. p. 8-10.
37 Shared Use Mobility Center, Shared-Use Mobility Reference Guide. p. 11.
38 Shaheen, S. and M. Christensen, “Shared-Use Mobility Summit: Retrospective from North America’s first gathering on shared-use mobility,” p. 25.
39 Shaheen, S., et al., Shared Mobility: Definitions, Industry Developments, and Early Understanding, p. 14-16.
40 Kinney, J., “On-Demand Bus Service Arrives in New Jersey.” September 22, 2016. Next City.
https://nextcity.org/daily/entry/on-demand-bus-service-new-jersey-commute-new-york, accessed December 29, 2016.
41 Boston Region MPO, “Boston Region Metropolitan Planning Organization.” http://www.ctps.org/mpo, accessed December 29, 2016.
42 Boston Region MPO, Chapter 1: Transportation Planning For the Boston Region. Charting Progress to 2040, 2015,http://www.ctps.org/data/pdf/plans/lrtp/charting/2040_LRTP_Chapter1_final.pdf, accessed April 19, 2016, p. 1-6─1-14.
43 Mass INC Polling Group ULI Boston / New England Survey of 660 Young Professionals in Greater Boston. 2015, http://boston.uli.org/wp-content/uploads/sites/12/2015/11/Topline-2015-10-ULI-Boston.pdf, accessed April 19, 2016, p. 13-16.
44 Mass INC Polling Group ULI Boston / New England Survey of 660 Young Professionals in Greater Boston, p. 3-4.
45 Ibid.
46 Ibid.
47 Hallock, L., and J. Inglis, The Innovative Transportation Index, 2015,Frontier Group and US PIRG,http://www.uspirg.org/sites/pirg/files/reports/Innovative_Transportation_Index_USPIRG.pdf. Accessed April 19, 2016, p. 27.; Hilkevitch, J, “Transit agencies moving over to make room for ride-share services,” November 23, 2015, The Chicago Tribune,http://www.chicagotribune.com/news/columnists/ct-transit-ride-sharing-getting-around-met-1123-20151123-column.html, accessed April 19, 2016.
48 Uber, “Our Trip History,” https://www.uber.com/our-story/, accessed January 7, 2017.
49 Up Hail, 2016. “Taxi & Rideshare Services in Massachusetts,” 2016, https://uphail.com/us/ma/, accessed October 22, 2016.
50 Sullivan, J., “Uber finds a way at Logan.”August 5, 2016, Commonwealth Magazine.
http://commonwealthmagazine.org/economy/uber-finds-a-way-at-logan/, accessed April 24, 2016.
51 Uber, “UberTAXI.” , http://boston.ubermovement.com/ubertaxi/, accessed April 24, 2016; Zhou. C., “Piloting uberACCESS in Boston,” September 10, 2015, https://newsroom.uber.com/us-massachusetts/piloting-uberaccess-in-boston/, accessed April 24, 2016; Uber, Celebrating One Year of uberPOOL in Massachusetts,” August 9, 2016, https://newsroom.uber.com/us-massachusetts/celebrating-one-year-of-uberpool-in-massachusetts/, accessed January 7, 2017; Uber,“Learn about uberTAXI in Boston,” 2016, https://www.uber.com/boston-drivers/services/ubertaxi/, accessed January 7, 2017.
52 Ingram, D., “Massachusetts to tax ride-hailing apps, give the money to taxis,” August 19, 2016. Reuters, http://www.reuters.com/article/us-massachusetts-uber-idUSKCN10U1ST, accessed January 7, 2017.
53 Miller, J., “Baker will sign Uber, Lyft legislation,” August 5, 2016, The Boston Globe, https://www.bostonglobe.com/metro/2016/08/04/baker-will-sign-uber-legislation/yKzTOGU6yh7oTQp1cMQz2K/story.html, accessed October 22, 2016.
54 Uber, “6 Months of uberPOOL in Boston: Going Further, Doing More—Together,” February 29, 2016, https://newsroom.uber.com/us-massachusetts/6-months-of-uberpool-in-boston-going-further-doing-more-together/, accessed April 24, 2016.
55 Uber, “Celebrating One Year of uberPOOL in Massachusetts,” August 9, 2016, https://newsroom.uber.com/us-massachusetts/celebrating-one-year-of-uberpool-in-massachusetts/, accessed January 7, 2017.
56 Uber, “July POOL Pass: Ride for a penny all month long,” June 19, 2016. https://newsroom.uber.com/us-massachusetts/july-pool-pass-ride-for-a-penny-all-month-long/, accessed January 7, 2017
57 Uber, “Get more with flat fare rides.” https://www.uber.com/info/plus/boston/, accessed January 7, 2017.
58 Peltier, D. “Uber and Lyft’s Growth Is Slowing in Most Major U.S. Cities,” October 12, 2016, Skift, https://skift.com/2016/10/12/uber-and-lyfts-growth-is-slowing-in-most-major-u-s-cities/, accessed January 7, 2017.
59 Lyft, “Lyft Line Turns Two,” August 26, 2016, https://blog.lyft.com/posts/lyft-line-turns-two, accessed January 7, 2017.
60 Van Buren, A., “Uber Cuts Prices in January, Responding to Weather and, Perhaps, Competition,” January 21, 2016, Travel and Leisure. http://www.travelandleisure.com/articles/uber-fare-decrease, accessed April 24, 2016.
61 Up Hail, “Taxi & Rideshare Services in Massachusetts,” 2016, https://uphail.com/us/ma/, accessed October 22, 2016.
62 Lyft. “Boston Area.” https://www.lyft.com/cities/boston, accessed February 8, 2017.
63 Fasten,“Coverage in Boston.” https://fasten.com/cities, accessed January 7, 2017.
64 Zemcar, “How Zemcar Works,” 2016, http://www.zemcar.com/index#work, accessed April 24, 2016; WCVB, “Cambridge-based startup offers ride services for children,” February 10, 2016, http://www.wcvb.com/money/cambridgebased-startup-offers-ride-services-for-children/37925862, accessed April 24, 2016.
65 US Department of Labor Bureau of Occupational Employment Statistics, “Occupational Employment and Wages, May 2015: 53-3041 Taxi Drivers and Chauffeurs,” 2016, “http://www.bls.gov/oes/current/oes533041.htm#(1),” accessed January 7, 2017.
66 Enwemeka, Z., “In Fight Against Uber, Can Apps Give Boston Taxis A Lift?” October 2, 2015, WBUR News, http://www.wbur.org/2015/10/02/boston-taxi-apps, Accessed April 24, 2016.
67 Burke, A., “Taxis look to apps, Uber-style, to save the cab.” February 2, 2016, betaBoston,
http://www.betaboston.com/news/2016/02/02/taxis-look-to-apps-uber-style-to-save-the-cab/,accessed April 24, 2016.
68 Dholakia, U., “Everyone Hates Uber’s Surge Pricing – Here’s How to Fix It,” December 21, 2015. Harvard Business Review, https://hbr.org/2015/12/everyone-hates-ubers-surge-pricing-heres-how-to-fix-it, accessed January 7, 2017.
69 Miller, J., “Baker will sign Uber, Lyft legislation.”
70 Vaccaro, A., “Law would require Uber to pay a nickel for every ride to help the taxi industry,” August 1, 2016. Boston.com, http://www.boston.com/news/business/2016/08/01/new-law-require-uber-pay-5-cents-every-ride-taxi-industry, accessed January 7, 2017.
71 Taylor, H., “Uber and Lyft are getting pushback from municipalities all over the US,” September 2, 2016, CNBC, http://www.cnbc.com/2016/09/02/uber-and-lyft-are-getting-pushback-from-municipalities-all-over-the-us.html, accessed January 7, 2017.
72 Vaccaro, A., “Law would require Uber to pay a nickel for every ride to help the taxi industry,” August 1, 2016, boston.com, http://www.boston.com/news/business/2016/08/01/new-law-require-uber-pay-5-cents-every-ride-taxi-industry, accessed January 7, 2017. Vaccaro, A., “Cambridge says the new Mass. Uber law should end cabbies’ complaints,” August 16, 2016. boston.com, http://www.boston.com/news/business/2016/08/16/cambridge-says-the-new-mass-uber-law-should-end-cabbies-complaints, accessed January 7, 2017.
73 An Act Regulating Transportation Network Companies. 2016 Mass. Acts 187, §7,
August 5, 2016, https://malegislature.gov/Laws/SessionLaws/Acts/2016/Chapter187, accessed January 7, 2017.
74 Vaccaro, A., “Taxi drivers say new law is another burden on them,” September 23, 2016, The Boston Globe, http://www.bostonglobe.com/business/2016/09/23/taxi-group-sues-baker-other-officials-over-new-uber-law/aYZ5bx0vbL8jM7lkEfebkI/story.html?s_campaign=bdc:article:stub, accessed January 7, 2016.
75 Committee for Review of Innovative Urban Mobility Services, Special Report 319: Between Public and Private Mobility: Examining the Rise of Technology-Enabled Transportation Services, Appendix A: Taxonomy of Established and Emerging Personal Transportation Services, p. 14.
76 Seelye, K., “To Lure Bostonians, New ‘Pop-Up’ Bus Service Learns Riders’ Rhythms,” June 5, 2014, The New York Times. http://www.nytimes.com/2014/06/05/us/to-lure-bostonians-new-pop-up-bus-service-learns-riders-rhythms.html?_r=0., accessed April 19, 2016; Committee for Review of Innovative Urban Mobility Services, Special Report 319: Between Public and Private Mobility: Examining the Rise of Technology-Enabled Transportation Services, Appendix A: Taxonomy of Established and Emerging Personal Transportation Services, p. 14.
77 Shaheen, S., et al., Shared Mobility: Definitions, Industry Developments, and Early Understanding, p. 15.
78 Ibid.
79 Bridj, “Greater Boston Service Area,” http://www.bridj.com/greater-boston-service-area/. Accessed January 3, 2017.
80 Gurley, G., “Bridj revs up,” January 12, 2016, Commonwealth Magazine. http://commonwealthmagazine.org/transportation/bridj-revs-up/,accessed April 19, 2016.
81 Subbaraman, N., “Skedaddle expands bus service to Philly, DC — eyes San Francisco as next stop,” February 11, 2016, betaBoston. http://www.betaboston.com/news/2016/02/11/skedaddle-expands-bus-service-to-philly-dc-eyes-san-francisco-as-next-stop/, accessed April 19, 2016.
82 Luna, T., “Cambridge greenlights Bridj on-demand bus pilot.” November 13, 2015, The Boston Globe, https://www.bostonglobe.com/business/2014/11/13/bridj-set-for-demand-bus-service-pilot-program-cambridge/CVulaQy2NFLwtOO9E2S0PL/story.html, accessed April 19, 2016;
83 Barr, J., Memorandum to A. Jackson, Chairperson, City of Cambridge (MA) License Commission, re: GroupZoom (Bridj) Jitney Application, July 21, 2015, http://www2.cambridgema.gov/CityOfCambridge_Content/documents/Bridj%2009212015.pdf, accessed April 19, 2016.
84 City of Cambridge, Massachusetts, City Manager Order, September 21, 2015, http://www2.cambridgema.gov/cityClerk/cmOrder.cfm?item_id=34759&order=1&pv=Yes, accessed April 19, 2016.
85 Silva, H., et al., “10 Things You Didn't Know About Zipcar (Okay, More Than 10),” 2016, Ziptopia, http://www.zipcar.com/ziptopia/inside-zipcar/history-of-zipcar-infographic, accessed April 19, 2016.
86 Zipcar, “Zipcar overview,” http://www.zipcar.com/press/overview, accessed October 22, 2016.
87 Zipcar, “Zipcar overview,” http://www.zipcar.com/press/overview, accessed October 22, 2016.
88 Chesto, J., “Zipcar seeks 150 drive-anywhere permits,” February 24, 2015, The Boston Globe, (https://www.bostonglobe.com/business/2015/02/24/zipcar-picks-boston-add-new-kind-car-sharing-service/EjdIR4rBKjL2e2jsUHxvUL/story.html, accessed April 19, 2016.
89 Zipcar, “Find Zipcars parked near MBTA stations,” http://www.zipcar.com/zipmbta, accessed April 19, 2016.
90 Zipcar, “Zipcar celebrates 15 years of making cities better places to live,” January 13, 2015, http://www.zipcar.com/press/releases/15years, accessed April 19, 2016.
91 Shared Use Mobility Center, “Five Takeaways from Zipcar’s ONE>WAY Pilot,” March 6, 2015, http://sharedusemobilitycenter.org/news/zipcar-oneway-pilot-snapshot/, accessed April 19, 2016.
92 Enterprise CarShare, “Our Story.” https://www.enterprisecarshare.com/us/en/our-story.html. accessed April 19, 2016.
93 Personal communication with Christian Wright at Enterprise Carshare, April 7, 2016.
94 Ibid.
95 Bodley, M., “GM’s venture in crowded car-sharing industry arrives in Boston,” July 5, 2016, The Boston Globe, http://www.bostonglobe.com/business/2016/07/05/gmcarshare/BcIsk9L5v08ZwztpeihzXJ/story.html?event=event12, accessed Oct 22, 2016.
96 Shared Use Mobility Center – Shared Use Mobility Toolkit, Boston area. http://maps.sharedusemobilitycenter.org/sumc/#, accessed January 3, 2017.
97 Ibid.
98 City of Boston, “Drive Boston,” http://www.cityofboston.gov/transportation/driveboston.asp, accessed January 7, 2017.
99 Chesto, J., “Zipcar seeks 150 drive-anywhere permits.”
100 Hubway, “Frequently Asked Questions,” https://www.thehubway.com/how-it-works/faq, accessed January 7, 2017.
101 Hubway, “Hubway Media Kit,” http://www.thehubway.com/mediakit, accessed April 19, 2016.
102 Committee for Review of Innovative Urban Mobility Services, Special Report 319: Between Public and Private Mobility: Examining the Rise of Technology-Enabled Transportation Services, Appendix A: Taxonomy of Established and Emerging Personal Transportation Services, p. 9.
103 Hubway, “Hubway Media Kit.”
104 Boston Transportation Department, GoBoston 2030 Vision Framework (draft for public review), 2015, http://goboston2030.org/flipbook/files/00_Entire-report-for-download.pdf, accessed April 19, 2016.
105 Feigon, S. and C. Murphy,TCRP Report 188: Shared Mobility and the Transformation of Public Transit, 2016,Transportation Research Board, https://www.nap.edu/download/23578#, accessed January 7, 2016, p. 7, B-2
106 Shared Use Mobility Center. 2016. Shared Mobility and the Transformation of Public Transit: Research Analysis. American Public Transportation Association, http://sharedusemobilitycenter.org/wp-content/uploads/2016/04/Final_TOPT_DigitalPagesNL.pdf, accessed April 19, 2016, pg. 35
107. Feigon, S. and C. Murphy, TCRP Report 188: Shared Mobility and the Transformation of Public Transit, p. B-2.
108 Shared Use Mobility Center, Shared Mobility and the Transformation of Public Transit: Research Analysis, p. 35.
109 Feigon, S. and C. Murphy, TCRP Report 188: Shared Mobility and the Transformation of Public Transit, p. 6.
110 Shared Use Mobility Center, Shared Mobility and the Transformation of Public Transit: Research Analysis, p. 35.
111 Ibid.
112 Ibid.
113 Ibid., p.6.
114 Ibid., p. 22.
115 Ibid., p. 6.
116 Ibid., p. 22.
117 Feigon, S. and C. Murphy, TCRP Report 188: Shared Mobility and the Transformation of Public Transit, p. 8.
118 Ibid., p. 27-28.
119 Ibid., p. 8.
120 7ParkData Inc., The Trillion Dollar View: Ridesharing, October 2016, Insight Series, https://cdn2.hubspot.net/hubfs/447976/Gated_Content_and_Reports/Ridesharing/PREVIEW_-_The_Trillion_Dollar_View_-_Ridesharing_-_October_2016.pdf?t=1476224418675&utm_campaign=Ridesharing&utm_source=hs_automation&utm_medium=email&utm_content=35693814&_hsenc=p2ANqtz-_2LVW4os6CPtTBUf0rK5_-kg6w2vvcIRCrUVuYdKmJBEqrIcK91lYIpmj7tROqooBdG9Jd2miS1bKMqBV3sd8BqhwBOQ&_hsmi=35693814, accessed January 7, 2017, p 1.
121 Morning Consult, “National Tracking Poll #150505, May 29-31, 2015, Cross Tabulation Results,” https://morningconsult.com/wp-content/uploads/2015/06/150505_crosstabs_mc_v2_AD-2.pdf. Accessed April 19, 2016, p. 1, 23-28; Smith, A., Shared, Collaborative, and On Demand: The New Digital Economy. 2016, Pew Research Center, http://www.pewinternet.org/2016/05/19/the-new-digital-economy/, accessed January 7, 2017, p. 67.
122 Smith, A., Shared, Collaborative, and On Demand: The New Digital Economy, p. 18.
123 Morning Consult, “National Tracking Poll #150505, May 29-31, 2015, Cross Tabulation Results,” p. 23-28.
124 Ibid.
125 Shared Use Mobility Center, Shared Mobility and the Transformation of Public Transit: Research Analysis, p. 15.
126 Smith, A., Shared, Collaborative, and On Demand: The New Digital Economy, p. 18.
127 Morning Consult, “National Tracking Poll #150505, May 29-31, 2015, Cross Tabulation Results,” p. 23-28.
128 Smith, A., Shared, Collaborative, and On Demand: The New Digital Economy, p. 18.
129 Morning Consult, “National Tracking Poll #150505, May 29-31, 2015, Cross Tabulation Results,”, p. 23-28.
130 Morning Consult, “National Tracking Poll #150505, May 29-31, 2015, Cross Tabulation Results,”, p. 23-28. Smith, A., Shared, Collaborative, and On Demand: The New Digital Economy, p. 18.
131 Rayle, L., et al., “App-Based, On-Demand Ride Services: Comparing Taxi and Ridesourcing Trips and User Characteristics in San Francisco,” 2014, http://www.its.dot.gov/itspac/Dec2014/RidesourcingWhitePaper_Nov2014.pdf, accessed April 19, 2016, p. 8.
132 Millard-Ball, A., et al. TCRP Report 108: Carsharing: Where and How It Succeeds, 2005, Transportation Research Board, http://onlinepubs.trb.org/onlinepubs/tcrp/tcrp_rpt_108.pdf,
accessed April 19, 2016, 3-9—3-11.
133 Martin, E., et al., “Impact of Carsharing on Household Vehicle Holdings: Results from North American Shared-Use Vehicle Survey,” Transportation Research Record: Journal of the Transportation Research Board, No. 2143 (2010), p. 153.
134 Martin, E. and S. Shaheen, “The Impact of Carsharing on Public Transit and Non-Motorized Travel: An Exploration of North American Carsharing Survey Data,” Energies 2011: 4. 2094-2114. doi:10.3390/en4112094, accessed April 19, 2016, p. 2100.
135 Martin, E., et al., “Impact of Carsharing on Household Vehicle Holdings: Results from North American Shared-Use Vehicle Survey,” p.153.
136 Dill, J.et al., “Who Uses Peer-to-Peer Carsharing? An Early Exploration,” 2015, Transportation Research Board Annual Meeting 2015 Paper #15-3881.
137 Fishman, E. “Bikeshare: A Review of Recent Literature,” p. 109.
138 Shaheen, S. et al., Mineta Transportation Institute Report 12-29: Public Bikesharing in North Amercia during a Period of Rapid Expansion: Understanding Business Models, Industry Trends, and User Impacts, 2014, http://transweb.sjsu.edu/PDFs/research/1131-public-bikesharing-business-models-trends-impacts.pdf, accessed April 19, 2016, p. 65-71
139 Buck, D. et al., “Are Bikeshare Users Different from Regular Cyclists? A First Look at Short-Term Users, Annual Members, and Area Cyclists in the Washington, D.C. Region,” 2012, http://docs.trb.org/prp/13-5029.pdf, accessed April 19, 2016, p. 6-8.
140 Shaheen, S. et al., Mineta Transportation Institute Report 12-29: Public Bikesharing in North Amercia during a Period of Rapid Expansion: Understanding Business Models, Industry Trends, and User Impacts, p. 1.
141 Ibid., p. 40, 45.
142 Shaheen, S., et al, Bay Area Bike Share Casual Users Survey Report: A comparative analysis of existing and potential bikesharing users. 2015, http://innovativemobility.org/wp-content/uploads/2015/05/Bay-Area-Bike-Share-Final-Casual-User-Report.pdf, accessed April 19, 2016, p 12.
143 Ibid., p. 10-12.
144 Shared Use Mobility Center, Shared Mobility and the Transformation of Public Transit: Research Analysis, p. 11.
145 Rayle, L., et al., “App-Based, On-Demand Ride Services: Comparing Taxi and Ridesourcing Trips and User Characteristics in San Francisco.” p. 10, 18.
146 Shared Use Mobility Center, Shared Mobility and the Transformation of Public Transit: Research Analysis. p. 11.
147 Rayle, L., et al., “App-Based, On-Demand Ride Services: Comparing Taxi and Ridesourcing Trips and User Characteristics in San Francisco,” p. 10-11.
148 Shared Use Mobility Center, Shared Mobility and the Transformation of Public Transit: Research Analysis, p. 15.
149 Ibid.
150 Lyft, Lyft Economic Impact: 2015 Report, 2015, https://static1.squarespace.com/static/5330a423e4b07cae635bb95e/t/564a88b2e4b04d9b27f356f3/1447725234997/Lyft+Economic+Impact+Report+(2).pdf, accessed April 19, 2016, p. 10.
151 Rayle, L., et al., “App-Based, On-Demand Ride Services: Comparing Taxi and Ridesourcing Trips and User Characteristics in San Francisco,” p. 7-8, 10, 11.
152 Bialik, C., et al., “Is Uber Making NYC Rush-Hour Traffic Worse?” December 9, 2015. FiveThirtyEight, http://fivethirtyeight.com/features/is-uber-making-nyc-rush-hour-traffic-worse/, accessed April 19, 2016.
153 Shared Use Mobility Center, Shared Mobility and the Transformation of Public Transit: Research Analysis, p. 11.
154 Ibid., p. 13.
155 Feigon, S. and C. Murphy, TCRP Report 188: Shared Mobility and the Transformation of Public Transit, p. 7, B-2. C. Murphy provided a separate chart showing data for Boston only on January 3, 2017.
156 Rayle, L., et al., “App-Based, On-Demand Ride Services: Comparing Taxi and Ridesourcing Trips and User Characteristics in San Francisco,” p. 14.
157 Ibid, p. 13.
158 Ibid., p. 18.
159 Lyft, Lyft Economic Impact: 2015 Report, p. 9.
160 Smith, A., Shared, Collaborative, and On Demand: The New Digital Economy, p. 27.
161 Ibid., p. 29.
162 Millard-Ball, A., et al., TCRP Report 108: Carsharing: Where and How It Succeeds, p. 3-4, 3-12—3-14.
163 Metropolitan Washington Council of Governments, National Capital Region Transportation Planning Board Commuter Connections Program: Carshare Survey 2008, 2009, https://www.mobilitylab.org/wp-content/uploads/2014/02/MWCOG_TPB_Carshare2008FinalReport012709.pdf, accessed April 19, 2016,p 14; Denver Public Works, Denver Car Share Program 2013-2014 Assessment: Final Report, 2014,https://www.denvergov.org/content/dam/denvergov/Portals/681/documents/CarShare%20Program%20Assessment.pdf, accessed April 19, 2016, p. 5.
164 Denver Public Works, Denver Car Share Program 2013-2014 Assessment: Final Report, p. 5.
165 Millard-Ball, A., et al., TCRP Report 108: Carsharing: Where and How It Succeeds, p. 3-12; Metropolitan Washington Council of Governments, National Capital Region Transportation Planning Board Commuter Connections Program: Carshare Survey 2008, p. 23.
166 Seattle Department of Transportation, 2013 Seattle Free-Floating Car Share Pilot Program Report, 2014, https://worldstreets.files.wordpress.com/2014/04/2013_free_floating_car_share_report.pdf, accessed April 19, 2016, p. 7; Metro Vancouver, The Metro Vancouver Car Share Study: Technical Report, 2014, http://www.metrovancouver.org/services/regional-planning/PlanningPublications/MetroVancouverCarShareStudyTechnicalReport.pdf, accessed April 19, 2016, p. 33.
167 Shared Use Mobility Center, “Five Takeaways from Zipcar’s ONE>WAY Pilot,” March 6, 2015, http://sharedusemobilitycenter.org/news/zipcar-oneway-pilot-snapshot/, accessed April 19, 2016.
168 Metropolitan Washington Council of Governments, National Capital Region Transportation Planning Board Commuter Connections Program: Carshare Survey 2008, p. 15.
169 Shared Use Mobility Center. Shared Mobility and the Transformation of Public Transit: Research Analysis, p. 12.
170 Kim, K., “Can carsharing meet the mobility needs for the low-income neighborhoods? Lessons from carsharing usage patterns in New York City,” 2015. Transportation Research Part A: Policy and Practice, 77:(2015), p. 249–260,accessed January 7, 2017, p. 252.
171 Metropolitan Washington Council of Governments, National Capital Region Transportation Planning Board Commuter Connections Program: Carshare Survey 2008, p. 20.
172 Shared Use Mobility Center, Shared Mobility and the Transformation of Public Transit: Research Analysis, p 12.
173 Fishman, E., “Bikeshare: A Review of Recent Literature,” p. 92, 98.
174 Buck, D. et al., “Are Bikeshare Users Different from Regular Cyclists? A First Look at Short-Term Users, Annual Members, and Area Cyclists in the Washington, D.C. Region,” p. 9.
175 Capital Bikeshare, Capital Bikeshare 2012 Member Survey Report, 2013, https://d21xlh2maitm24.cloudfront.net/wdc/cabi-2012surveyreport.pdf?mtime=20161206135939, accessed March 5, 2017, p. 23-24.
176 Ibid, p. 23.
177 Fishman, E., “Bikeshare: A Review of Recent Literature,” p. 95.
178 Ibid., p. 96.
179 Shared Use Mobility Center, Shared Mobility and the Transformation of Public Transit: Research Analysis, p. 12.
180 Shaheen, S., et al., Bay Area Bike Share Casual Users Survey Report: A comparative analysis of existing and potential bikesharing users, p. 17.
181 Capital Bikeshare, Capital Bikeshare 2012 Member Survey Report, p. 15.
182 Ibid, p. 16.
183 Feigon, S. and C. Murphy, TCRP Report 188: Shared Mobility and the Transformation of Public Transit, p. 1.
184 Ibid., p. 9-11.
185 Ibid, p. 11.
186 Ibid, p. 12.
187 Ibid, p. 2.
188 Ibid.
189 Ibid, p. 11.
190 Ibid, p. 12.
191 US DOT FHWA, “U.S. Transportation Secretary Anthony Foxx Announces $56.6 Million in Advanced Transportation Technology Grants,” https://www.transportation.gov/sites/dot.gov/files/docs/FactSheet_ATCMTD_20161013.pdf, accessed January 7, 2017.
192 USDOT FTA, “U.S. Transportation Secretary Foxx Announces $8 Million in Groundbreaking Mobility on Demand Grants to Transform Public Transit ,“ https://www.transportation.gov/sites/dot.gov/files/docs/FactSheet_MOD_20161013.pdf, accessed January 7, 2017.
193 Smith, A., Shared, Collaborative, and On Demand: The New Digital Economy, p. 20.
194 Ibid.
195 Lyft, Lyft Economic Impact: 2015 Report, p. 14.
196 Rayle, L., et al., “App-Based, On-Demand Ride Services: Comparing Taxi and Ridesourcing Trips and User Characteristics in San Francisco,” p. 13.
197 Ibid.
198 Ibid.
199 Lyft, Lyft Economic Impact: 2015 Report, p. 14.
200 Lyft, “Friends with Transit,” http://take.lyft.com/friendswithtransit/, accessed April 19, 2016.
201 Uber, “How Uber is getting more people to and from the T,” May 16, 2016, https://newsroom.uber.com/us-massachusetts/the-multimodal-goal-how-uber-is-getting-more-people-to-and-from-the-t/, accessed January 7, 2017.
202 Uber, “Uber and Public Transit: Working Hand in Hand in New Jersey,” October 30, 2015, accessed April 19, 2016; Uber, “One Year of Moving Connecticut,” April 23, 2015; https://newsroom.uber.com/us-connecticut/one-year-of-moving-connecticut/, accessed April 19, 2016.
203 Tsay, S., “What does complementing transit mean for Uber, exactly?” March 5, 2015. TransitCenter, http://transitcenter.org/2015/03/05/what-does-complementing-transit-mean-for-uber-exactly/, accessed April 20, 2016.
204 Zeeble, B., “DART Works With Lyft, Uber, Zipcar To Ease Your Trip.” October 28, 2015. KERA News,http://keranews.org/post/dart-works-lyft-uber-zipcar-ease-your-trip, accessed April 20, 2016.;
205 Montlick & Associates Injury Attorneys, “MARTA now paired with ride share company Uber,” September 29, 2015; http://www.montlick.com/montlick-blog/auto-accidents/2484-marta-now-partnered-with-ride-share-company-uber#.Vr5Z4_krKM8, accessed April 20, 2016
206 Njus, E., “New version of TriMet Tickets app includes Lyft, Car2Go tie-in,” May 4, 2016. The Oregonian, http://www.oregonlive.com/commuting/index.ssf/2016/05/new_version_of_trimet_tickets.html, accessed May 10, 2016.
207 Somerville, H., “Uber pushes into public transit with new app partnership,” January 11, 2016. Reuters. http://www.reuters.com/article/us-uber-partnership-idUSKCN0UP18L20160111, accessed April 23, 2016; Brasuell, J., “The Go LA App Offers a One-Stop Shop for Transportation Choices.” January 27, 2016, Planetizen, http://www.planetizen.com/node/83459/go-la-app-offers-one-stop-shop-transportation-choices, accessed April 23, 2016; Guernsey, N., “TransLoc and Uber Partner to Pioneer a New Standard in Public Transit,” January 11, 2016, TransLoc. http://transloc.com/transloc-and-uber-partner-to-pioneer-a-new-standard-in-public-transit/, accessed April 23, 2016.
208 Jaffe, E., “Uber and Public Transit Are Trying to Get Along.” August 3, 2015, CityLab, http://www.citylab.com/cityfixer/2015/08/uber-and-public-transit-are-trying-to-get-along/400283/?utm_source=SFTwitter, accessed April 20, 2016; King County (WA), “Emergency Ride Home – Redmond,” 2016. http://metro.kingcounty.gov/tops/van-car/programs/real-time/emergency-ride-home-redmond.html, accessed April 20, 2016.
209 Reuters, “First City In the Nation Plans to Subsidize Uber Rides,” March 3, 2016, Fortune, http://fortune.com/2016/03/03/uber-subsidy-public-transportation/, accessed April 20, 2016.
210 Dungca, N., “Uber finds a transit void to fill at North Shore Community College,” October 2, 2016. The Boston Globe, https://www.bostonglobe.com/metro/2016/10/02/uber-finds-transit-void-fill-north-shore-community-college/XlQBow3uT7Yczl52E4TDnL/story.html, accessed January 7, 2017.
211 Buell, S., “MBTA Will Now Let Mobility Impaired Riders Take Uber and Lyft,” September 16 2016. Boston Magazine, http://www.bostonmagazine.com/news/blog/2016/09/16/mbta-uber-lyft-ride/, accessed January 7, 2017.
212 Cooper, R. and S. Gilgore, “Metro shutdown: Financial winners and losers,” March 16, 2016. Washington Business Journal. http://www.bizjournals.com/washington/news/2016/03/16/metro-shutdown-inancial-winners-and-losers.html, accessed April 20, 2016.
213 Ibid.
214 Metro, “All Metrorail service will be suspended Wednesday, March 16, for emergency inspections,” March 15, 2015. http://www.wmata.com/about_metro/news/PressReleaseDetail.cfm?ReleaseID=6082, accessed May 10, 2016.
215 Siddiqui, F., “UberPool got a lot of new customers after Monday’s Metro meltdown,” March 15, 2016; The Washington Post, https://www.washingtonpost.com/news/dr-gridlock/wp/2016/03/15/uberpool-got-a-lot-of-new-customers-after-mondays-metro-meltdown/, accessed April 20, 2016.
216 Jaffe, E., “What Taxis Add to Public Transit,” February 3, 2012, CityLab, http://www.citylab.com/commute/2012/02/taxis-part-transit-system/1133/, accessed April 23, 2016.
217 Austin, D. and Zegras, P.C, The Taxicab as Public Transportation in Boston, http://www.transportchicago.org/uploads/5/7/2/0/5720074/2b1_taxiboston.pdf, accessed April 23, 2016, p. 20-21.
218 Ibid, p. 21.
219 Shared Use Mobility Center, Shared Mobility and the Transformation of Public Transit: Research Analysis, p. 16.
220 Feigon, S. and C. Murphy, TCRP Report 188: Shared Mobility and the Transformation of Public Transit, p. 17.
221 Smith, A., Shared, Collaborative, and On Demand: The New Digital Economy, p. 20.
222 Silver, N. and R. Fischer-Baum, “Public Transit Should Be Uber’s New Best Friend,” August 28, 2015, FiveThirtyEight,http://fivethirtyeight.com/features/public-transit-should-be-ubers-new-best-friend/,accessed April 23, 2016.
223 Ibid.
224 Rayle, L., et al., “App-Based, On-Demand Ride Services: Comparing Taxi and Ridesourcing Trips and User Characteristics in San Francisco,” p. 17.
225 Ibid, p 14-15.
226 Shaheen, S., et al., Shared Mobility: Definitions, Industry Developments, and Early Understanding, p. 12.
227 Shared Use Mobility Center, “Can Uber and Lyft Make Carpooling Cool?” April 1, 2015. http://sharedusemobilitycenter.org/news/can-uber-and-lyft-make-carpooling-cool/, accessed April 23, 2016.; Said, C., “Uber asks Pool users to push employers to subsidize commutes,” October 20, 2015, SFGate, http://www.sfgate.com/business/article/Uber-asks-Pool-users-to-push-employers-to-6579933.php, accessed April 20, 2016.
228 Shared Use Mobility Center. “Can Uber and Lyft Make Carpooling Cool?”
229 Jaffe, E., “How the microtransit movement is changing urban mobility.” April 27, 2015, CityLab, http://www.citylab.com/commute/2015/04/how-the-microtransit-movement-is-changing-urban-mobility/391565/, accessed April 20, 2016.
230 Stromberg, J., "These startups want to do for buses what Uber did for taxi rides,” July 7, 2015,Vox, http://www.vox.com/2015/7/7/8906027/microtransit-uber-buses, accessed April 23, 2016.
231 Waxmann, L., “Can New Shuttle Service Curb San Francisco’s Transportation Trouble?” February 22, 2016, Mission Local, http://missionlocal.org/2016/02/can-new-shuttle-service-curb-san-franciscos-transportation-trouble/,accessed April 20, 2016.
232 Said, C., “Uber asks Pool users to push employers to subsidize commutes.”;Uber. “uberPOOL now cheaper for commuters all over San Francisco,” December 1, 2015, https://newsroom.uber.com/us-california/uberpool-now-cheaper-for-commuters-all-over-san-francisco/, accessed April 20, 2016; Uber, “It’s a Beautiful (Pool) Day in the Neighborhood,” April 16, 2015, https://newsroom.uber.com/us-california/its-a-beautiful-pool-day-in-the-neighborhood/, accessed April 20, 2016.
233 Uber, “6 Months of uberPOOL in Boston: Going Further, Doing More—Together.”
234 Lyft, Lyft Economic Impact: 2015 Report, p. 13; Huet, E., “The Case For Carpooling: Inside Lyft And Uber's Quest To Squeeze More People In The Backseat,” August 18, 2015, Forbes. http://www.forbes.com/sites/ellenhuet/2015/08/18/inside-lyfts-and-ubers-carpooling-quest-uberpool-lyft-line/#2ffd1dc11a5e, accessed April 20, 2016.
235 Huet, E., “The Case For Carpooling: Inside Lyft And Uber's Quest To Squeeze More People In The Backseat.”
236 Fitzgerald, M.,“The Chariot Story,” November 23, 2015. Chariot, https://ridechariot.wordpress.com/2015/11/23/the-chariot-story,accessed April 20, 2016.
237 Ibid.
238 Waxmann, L., “Can New Shuttle Service Curb San Francisco’s Transportation Trouble?”
239 Kinney, J., “On-Demand Bus Service Arrives in New Jersey,” September 22, 2016, Next City. https://nextcity.org/daily/entry/on-demand-bus-service-new-jersey-commute-new-york, accessed October 22, 2016.
240 Uber, “How Uber is getting more people to and from the T,” May 16, 2016,https://newsroom.uber.com/us-massachusetts/the-multimodal-goal-how-uber-is-getting-more-people-to-and-from-the-t/, accessed January 7, 2017.
241 Uber, “MBTA + Uber Boston: A Love Story,” July 8, 2014, https://newsroom.uber.com/us-massachusetts/mbta-uber-boston-a-love-story/, accessed January 7, 2017.
242 Jaffe, E, “How the microtransit movement is changing urban mobility.”
243 Duncga, N, “MBTA to end late-night service by mid-March,” Boston Globe.February 29, 2016, The Boston Globe, https://www.bostonglobe.com/metro/2016/02/29/late-night-service-end-march-board-votes/bHZM7BHgU32YDn9zTX6OHK/story.html, accessed April 20, 2016; Bridj, “Late Night Matters,” 2016, http://www.bridjlatenight.com/, accessed April 20, 2016.
244 Uber, “By the Numbers: Commuting During the Metro Closure,” March 16, 2016, https://newsroom.uber.com/us-dc/trips-by-the-numbers-commuting-during-the-metro-closure/. accessed April 20, 2016.
245 Marshall, A., “Kansas City Is Embarking on a Great Microtransit Experiment,” February 17, 2016. CityLab, http://www.citylab.com/cityfixer/2016/02/kansas-city-bridj-microtransit/462615/, accessed April 20, 2016.
246 KCATA, “Bridj, KCATA Launch Pilot Program,” February 10, 2016, http://www.kcata.org/news/bridj_kcata_launch_pilot_program, accessed April 20, 2016.
247 Marshall, A., “Kansas City Is Embarking on a Great Microtransit Experiment.”
248 Uber, “July POOL Pass: Ride for a penny all month long,”; Lyft, “Now on Sale: Lyft Line Passes for November, “ October 24, 2016, https://blog.lyft.com/posts/now-on-sale-membership-passes-for-november, accessed January 7, 2017.
249 Stromberg, J., "These startups want to do for buses what Uber did for taxi rides.”
250 Stromberg, J., "These startups want to do for buses what Uber did for taxi rides;” Jaffe, E., “How the microtransit movement is changing urban mobility.”
251 Barr, J., Memorandum to A. Jackson, Chairperson, City of Cambridge (MA) License Commission, re: GroupZoom (Bridj) Jitney Application.
252 Bacon, J., “Step Aside, Uber. Bridj Is the Next Wave of Transportation Disruption;” April 4, 2015, Bacon’s Rebellion,
http://baconsrebellion.com/step-aside-uber-bridj-is-the-next-wave-of-transportation-disruption,?l, accessed April 23, 2016.
253 Barr, J., Memorandum to A. Jackson, Chairperson, City of Cambridge (MA) License Commission, re: GroupZoom (Bridj) Jitney Application.
254 Solomon, B. “Lyft Line Leapfrogs UberPool In Race To Cover U.S.” April 5, 2015, Forbes, http://www.forbes.com/sites/briansolomon/2016/04/05/lyft-line-leapfrogs-uberpool-in-race-to-cover-u-s/#3acd533a1515, accessed April 20, 2016; Kokalitcheva, K. “Lyft Expands Short-Distance Carpool Service Into 6 New Areas,” October 24, 2016, Forbes. http://fortune.com/tag/uberpool/, accessed April 20, 2016.
255 Kaufman, R., “Chasing the Next Uber.” March 21, 2016, NextCity, https://nextcity.org/features/view/helsinki-kutsuplus-on-demand-transportation-mobility-next-uber. accessed April 20, 2016.; Jaffe, E., “How the microtransit movement is changing urban mobility.”
256 Sulopluisto, O., “Why Helsinki's innovative on-demand bus service failed,” March 4, 2016,Citiscope, http://citiscope.org/story/2016/why-helsinkis-innovative-demand-bus-service-failed#sthash.KjPoFmjI.dpuf, accessed January 7, 2017.
257 Barr, J., Memorandum to A. Jackson, Chairperson, City of Cambridge (MA) License Commission, re: GroupZoom (Bridj) Jitney Application.
258 Uber, “It’s a Beautiful (Pool) Day in the Neighborhood.”
259 Martin, E., et al., “Impact of Carsharing on Household Vehicle Holdings: Results from North American Shared-Use Vehicle Survey,” p. 153.
260 Ibid, p. 157.
261 Shaheen, S. et al., “North American Carsharing 10 Year Retrospective,” 2009, Transportation Research Record: Journal of the Transportation Research Board, No. 2110. 35-44, p. 35-36.
262 Ibid, p. 35.
263 Martin, E. and S. Shaheen., Impacts of car2go on Vehicle Ownership, Modal Shift,
Vehicle Miles Traveled, and Greenhouse Gas Emissions:
An Analysis of Five North American Cities, 2016. http://innovativemobility.org/wp-content/uploads/2016/07/Impactsofcar2go_FiveCities_2016.pdf, accessed January 7, 2017, p. 10.
264 Shaheen, S. et al, “North American Carsharing 10 Year Retrospective,” p. 36-37.
265 Denver Public Works, Denver Car Share Program 2013-2014 Assessment: Final Report, p. 5.
266 Ibid, p. 6.
267 Martin, E. and S. Shaheen. Impacts of car2go on Vehicle Ownership, Modal Shift,
Vehicle Miles Traveled, and Greenhouse Gas Emissions: An Analysis of Five North American Cities, p. 16-18.
268 Metropolitan Washington Council of Governments, National Capital Region Transportation Planning Board Commuter Connections Program: Carshare Survey 2008, p. 34-35.
269 Zipcar, “Zipcar, MBTA Enhance Partnership to Reduce Car Ownership, Increase Commuting Options,” March 8, 2007, http://www.prnewswire.com/news-releases/zipcar-mbta-enhance-partnership-to-reduce-car-ownership-increase-commuting-options-51653902.html, accessed April 23, 2016.
270 Shared Use Mobility Center, Shared-Use Mobility Reference Guide, p. 31; Murphy, A.,“TriMet and Zipcar expand partnership to five locations,” March 19, 2015. TriMet News, http://news.trimet.org/2015/03/trimet-and-zipcar-expand-partnership-to-five-locations/, accessed April 23, 2016.
271 Shaheen, S. and M. Christensen, “Shared-Use Mobility Summit: Retrospective from North America’s first gathering on shared-use mobility,” p. 21; Chicago Transit Authority. “Multimodal Connections,” 2016, http://www.transitchicago.com/goinggreen/multimode.aspx#?carsharing, accessed April 23, 2016.
272 Feigon, S. and C. Murphy, TCRP Report 188: Shared Mobility and the Transformation of Public Transit, p. 13.
273 Zipcar, “Zipcar, MBTA Enhance Partnership to Reduce Car Ownership, Increase Commuting Options.”
274 Zipcar, “Zipcar Overview,” http://www.zipcar.com/press/overview.,accessed April 19, 2016.
275 Metropolitan Washington Council of Governments, National Capital Region Transportation Planning Board Commuter Connections Program: Carshare Survey 2008, p.39-40.
276 Denver Public Works, Denver Car Share Program 2013-2014 Assessment: Final Report p. 6.
277 Martin, E. and S. Shaheen., Impacts of car2go on Vehicle Ownership, Modal Shift, Vehicle Miles Traveled, and Greenhouse Gas Emissions: An Analysis of Five North American Cities. p 11-13.
278 Ibid.
279 Denver Public Works. Denver Car Share Program 2013-2014 Assessment: Final Report, p. 6; Metropolitan Washington Council of Governments, National Capital Region Transportation Planning Board Commuter Connections Program: Carshare Survey 2008, p. 39-40.
280 Martin, E. and S. Shaheen, “The Impact of Carsharing on Public Transit and Non-Motorized Travel: An Exploration of North American Carsharing Survey Data,” p. 2112.
281 Ibid., p. 2094.
282 Ibid.
283 Ibid, p. 2111.
284 Ibid, p. 2094-2095.
285 Nelson, J., “California Commute: Bike-sharing as a bridge between commute gaps,” July 7, 2015, The Los Angeles Times, http://www.latimes.com/local/california/la-me-california-commute-20150707-story.html, accessed April 23, 2016.
286 Ma, T. et al., “Bicycle Sharing and Transit: Does Capital Bikeshare Affect Metrorail Ridership in Washington, D.C.?” http://smartgrowth.umd.edu/assets/bikeshare_transit_for_parisws_v1.pdf, accessed January 7, 2017, p. 17.
287 Capital Bikeshare, Capital Bikeshare 2012 Member Survey Report, p. 29-30.
288 Ibid., p.48-49.
289 Feigon, S. and C. Murphy, TCRP Report 188: Shared Mobility and the Transformation of Public Transit, p. 13,17-18.
290 Ibid, p. 18.,
291 Fishman, E., “Bikeshare: A Review of Recent Literature,” p. 103-104.
292 Shaheen, S. et al., Mineta Transportation Institute Report 12-29: Public Bikesharing in North Amercia during a Period of Rapid Expansion: Understanding Business Models, Industry Trends, and User Impacts, p. 73-79.
293 Ibid, p. 74
294 Ibid, p. 77-78.
295 Ibid, p. 74-76.
296 Ibid, p. 77-78.
297 Ibid, p. 90.
298 Shaheen, S., et al., Shared Mobility: Definitions, Industry Developments, and Early Understanding, p. 10.
299 Ricci, M., “Bike sharing: A review of evidence on impacts and processes of implementation and operation,” 2015 Research in Transportation Business & Management, 15. 28-38, http://eprints.uwe.ac.uk/25488/, accessed January 7, 2017, p. 15-16.
300 Fishman, E., “Bikeshare: A Review of Recent Literature,” p. 109
301 Shaheen, S. et al., Mineta Transportation Institute Report 12-29: Public Bikesharing in North Amercia during a Period of Rapid Expansion: Understanding Business Models, Industry Trends, and User Impacts, p. 79-80..
302 Capital Bikeshare, Capital Bikeshare 2012 Member Survey Report, p. 48-49.
303 Ibid.
304 Capital Bikeshare, Capital Bikeshare 2012 Member Survey Report, p. 56.
305 Ibid, p. 59.
306 Fishman, E.,et al., “Bike share's impact on car use: evidence from the United States, Great Britain, and Australia,” https://www.academia.edu/12346820/Bike_share_s_impact_on_car_use_Evidence_from_the_United_States_Great_Britain_and_Australia, accessed February 6, 2017, p. 11.
p. 11.”
307 S. Shaheen and E. Martin, “Unraveling the Modal Impacts of Bikesharing.” Access Magazine 47: Fall 2015, http://www.accessmagazine.org/wp-content/uploads/sites/7/2015/12/access47.shaheen.pdf, accessed January 7, 2017, .p. 9.
308 Capital Bikeshare, Capital Bikeshare 2012 Member Survey Report, p. 53.
309 Ibid., p. 55
310 Ibid., p. 54.
311 Committee for Review of Innovative Urban Mobility Services, Special Report 319: Between Public and Private Mobility: Examining the Rise of Technology-Enabled Transportation Services, p. 84.
312 Committee for Review of Innovative Urban Mobility Services, Special Report 319: Between Public and Private Mobility: Examining the Rise of Technology-Enabled Transportation Services, p. 89-90.
313 Smith, A., et al., The Smartphone Difference, p. 13.
314 Perrin, A. and M. Duggan. Americans’ Internet Access: 2000-2015. 2015. Pew Research Center, http://www.pewinternet.org/files/2015/06/2015-06-26_internet-usage-across-demographics-discover_FINAL.pdf, accessed April 23, 2016, p 2, 4, 6..
315 Smith, A., et al. The Smartphone Difference, p. 3.
316 Kodransky, M., and G. Lewenstein, Connecting Low Income People to Opportunity with Shared Mobility. p. 15.
317 Ibid, p. 17-18.
318 Shared Use Mobility Center, Shared Mobility and the Transformation of Public Transit: Research Analysis, p. 18-20.
319 Shared Use Mobility Center, “Will Low-Income Residents Benefit Most from P2P Carsharing?,” June 18, 2015, http://sharedusemobilitycenter.org/news/will-low-income-residents-benefit-most-from-p2p-carsharing/, accessed April 23, 2016.
320 Hubway, “Boston's Low-Income Program,” 2016, https://www.thehubway.com/pricing/boston-bikes-membership, accessed January 7, 2017.
321 Ursaki, J. and L. Aultman-Hall, “Quantifying the Equity of Bikeshare Access in US,” 2015, http://chi.streetsblog.org/wp-content/uploads/sites/4/2016/03/Bikeshare_TRB_submission.pdf, accessed April 24, 2016, p 13.
322 Committee for Review of Innovative Urban Mobility Services, Special Report 319: Between Public and Private Mobility: Examining the Rise of Technology-Enabled Transportation Services, p. 83.
323 Kodransky, M., and G. Lewenstein, Connecting Low Income People to Opportunity with Shared Mobility, p. 19-22.
324 Smith, J., “Hubway plans ten new stations in Dot, Roxbury,” May 5, 2015, Dorchester Reporter, http://www.dotnews.com/2016/hubway-plans-ten-new-stations-dot-roxbury, accessed January 7, 2017.
325 Hughes, R. and D. MacKenzie, “Transportation network company wait times in Greater Seattle, and relationship to socioeconomic indicators,” Journal of Transport Geography, vol 56, October 2016, p. 36-44, http://dx.doi.org/10.1016/j.jtrangeo.2016.08.014, p. 13.
326 Smart, R. et al., Faster and Cheaper: How Ride-sourcing Fills a Gap in Low Income Los Angeles Neighborhoods, 2015, BOTEC Analysis Corporation, http://botecanalysis.com/wp-content/uploads/2015/07/LATS-Final-Report.pdf, accessed January 7, 2017, p.4.
327 Yanbo, G. et al. Racial and Gender Discrimination in Transportation Network Companies. 2016. National Bureau of Economic Research, http://www.nber.org/papers/w22776.pdf, accessed January 7, 2017, p. 18-19.
328 Ibid, p. 19.
329 Lazo, L., “Uber flirts with transit agencies across the U.S. for a share of paratransit services,” March 5, 2016, The Washington Post. https://www.washingtonpost.com/local/trafficandcommuting/uber-flirts-with-transit-agencies-across-the-us-for-a-share-of-paratransit-services/2016/03/05/5eb8b118-d751-11e5-9823-02b905009f99_story.html, accessed January 7, 2017; Lyft. 2015, “Accessible Vehicle Dispatch,” https://help.lyft.com/hc/en-us/articles/213584508-Accessible-Vehicle-Dispatch, accessed April 24, 2016.
330 Templeton, A. and J. Rosman, “Uber's Wheelchair-Accessible Option In Portland Doesn't Work 9 to 5,” May 18, 2015, Oregon Public Broadcasting. http://www.opb.org/news/article/ubers-wheelchair-accessible-option-in-portland-doesnt-work-9-to-5/, accessed January 7, 2017; Addady, M., “Uber and Lyft Are Giving Subsidized Rides to Customers with Disabilities,” September 29, 2016, Fortune, http://fortune.com/2016/09/18/uber-lyft-accessible/, accessed January 7, 2017.
331 Lapowsky, I., “Uber’s Business Isn’t Built to Help Disabled People,” August 14, 2015, Wired, http://www.wired.com/2015/08/uber-disability/, accessed April 24, 2016; Committee for Review of Innovative Urban Mobility Services, Special Report 319: Between Public and Private Mobility: Examining the Rise of Technology-Enabled Transportation Services, p. 29, 85-86.
332 Committee for Review of Innovative Urban Mobility Services, Special Report 319: Between Public and Private Mobility: Examining the Rise of Technology-Enabled Transportation Services, p. 29, 92.
333 Lapowsky, I., “Uber’s Business Isn’t Built to Help Disabled People.”; Committee for Review of Innovative Urban Mobility Services, Special Report 319: Between Public and Private Mobility: Examining the Rise of Technology-Enabled Transportation Services, p 86; Bragg, C. “Disability Rights Groups back Uber’s Upstate Push.” December 20, 2017, timesunion, http://www.timesunion.com/local/article/Disability-rights-groups-back-Uber-s-upstate-push-6711796.php, accessed April 24, 2016.
334 Lapowsky, I., “Uber’s Business Isn’t Built to Help Disabled People.”
335 Rayle, L., et al, “App-Based, On-Demand Ride Services: Comparing Taxi and Ridesourcing Trips and User Characteristics in San Francisco,” p. 3.
336 Committee for Review of Innovative Urban Mobility Services, Special Report 319: Between Public and Private Mobility: Examining the Rise of Technology-Enabled Transportation Services, Appendix B: Taxi, Sedan, and Limousine Industries and Regulations, 2015, Transportation Research Board, http://onlinepubs.trb.org/onlinepubs/sr/sr319AppendixB.pdf, accessed April 19, 2016, p. 24-25.
337 Levine, D.,“Uber drivers remain independent contractors as lawsuit settled,” April 22, 2016, Reuters, http://www.reuters.com/article/us-uber-tech-drivers-settlement-idUSKCN0XJ07H, accessed April 24, 2016.
338 Committee for Review of Innovative Urban Mobility Services, Special Report 319: Between Public and Private Mobility: Examining the Rise of Technology-Enabled Transportation Services, p. 24-38, 72-76; Schaller, B., Unfinished Business: A Blueprint for Uber, Lyft and Taxi Regulation, 2015, http://www.schallerconsult.com/rideservices/blueprint.pdf, accessed January 7, 2017, p. 4.
339 Committee for Review of Innovative Urban Mobility Services, Special Report 319: Between Public and Private Mobility: Examining the Rise of Technology-Enabled Transportation Services, p. 34-6.
340 Ibid, p. 45, 86.
341Ibid, p. 50, 89-90.
342 Ibid, p. 44-48.
343 Committee for Review of Innovative Urban Mobility Services, Special Report 319: Between Public and Private Mobility: Examining the Rise of Technology-Enabled Transportation Services, p. 33; Property Casualty Insurers Association of America, “Transportation Network Companies: States with Enacted Legislation,” 2016, http://viewer.zmags.com/publication/60841263#/60841263/1, accessed Oct 22, 2016.
344 Committee for Review of Innovative Urban Mobility Services, Special Report 319: Between Public and Private Mobility: Examining the Rise of Technology-Enabled Transportation Services, p. 33.
345 WageWorks, “WageWorks Partners with Uber to Offer Pre-Tax Commuter Benefits for uberPOOL,” August 30, 2016, https://www.wageworks.com/about/news/press-releases/august-2016/wageworks-partners-with-uber-to-offer-pre-tax-commuter-benefits-for-uberpool/, accessed October 8, 2016.
346 Cohen, J., “These U.S. Reps Want to Redefine Bike-Share,” January 25, 2016, Next City.
https://nextcity.org/daily/entry/federal-bill-redefine-bike-share-us, accessed April 24, 2016.
347 Newsday/AM New York, “MTA blames loss of transit revenue on Uber, Lyft,” November 18, 2015, AM New York. http://www.amny.com/transit/mta-blames-loss-of-transit-revenue-on-uber-lyft-1.11140524, accessed April 24, 2016; City of New York, For-Hire Vehicle Transportation Study, 2016, http://www1.nyc.gov/assets/operations/downloads/pdf/For-Hire-Vehicle-Transportation-Study.pdf, accessed April 24, 2016, p. 15.
348 NY1 News, “State Lawmakers Propose Giving Portion of Sales Tax Revenue for Uber and Lyft Rides to MTA,” January 13, 2016, http://www.ny1.com/nyc/all-boroughs/news/2016/01/13/state-lawmakers-propose-giving-portion-of-sales-tax-revenue-for-uber-and-lyft-rides-to-mta.html, accessed April 24, 2016.
349 Transportation for Massachusetts, Fast Forward: The Technology Revolution in
Transportation and What It Means for Massachusetts, 2016, https://d3n8a8pro7vhmx.cloudfront.net/t4ma/pages/37/attachments/original/1476108942/t4ma_Fast_Forward_FINAL.compressed.pdf?1476108942, accessed January 7, 2017, p. 59.
350 Felsenthal, C., “Ray LaHood Calls Out Uber for Distracting Drivers.” December 23, 2014,Chicago Magazine, http://www.chicagomag.com/Chicago-Magazine/Felsenthal-Files/December-2014/Uber/, accessed May 10, 2016.
351 Shared Use Mobility Center,S hared-Use Mobility Reference Guide. p. 11, 41-2; Stromberg, J. "These startups want to do for buses what Uber did for taxi rides.”
352 Committee for Review of Innovative Urban Mobility Services, Special Report 319: Between Public and Private Mobility: Examining the Rise of Technology-Enabled Transportation Services, p. 101.
353 Eaken, A., “NRDC Urban Solutions to Lead First Climate Analysis of Uber and Lyft,” November 13, 2015; Natural Resources Defense Council, https://www.nrdc.org/experts/amanda-eaken/nrdc-urban-solutions-lead-first-climate-analysis-uber-and-lyft, accessed January 7, 2016.
354 City of New York, For-Hire Vehicle Transportation Study. p. 5.
355 Ibid.
356 Shared Use Mobility Center, Shared-Use Mobility Reference Guide. p. 12.
357 Shared Use Mobility Center, “The Silicon Valley Agency Launching its Own Microtransit Service,” January 10, 2016, http://sharedusemobilitycenter.org/uncategorized/the-silicon-valley-agency-launching-its-own-microtransit-service/, accessed January 29, 2016.
358 Jaffe, E., “How the microtransit movement is changing urban mobility.”
359 Associated Press, “Uber not the only ride-hailing company with sights set on driverless cars,” September 18, 2016, CBS News, http://www.cbsnews.com/news/uber-not-the-only-ride-hailing-company-with-sights-set-on-driverless-cars-lyft/, accessed October 22, 2016.
360 City of Boston Mayor’s Office,“Mayor Walsh Announces Autonomous Vehicles Initiative,” September 14, 2016, https://www.boston.gov/news/mayor-walsh-announces-autonomous-vehicle-initiative, accessed January 7, 2017.
361 Salomon, J., “Somerville will be a testing ground for networked traffic management and self-parking cars,” November 24, 2015, Boston.com, http://www.boston.com/cars/news-and-reviews/2015/11/24/somerville-will-be-a-testing-ground-for-networked-traffic-management-and-self-parking-cars, accessed January 7, 2017.
362 Kinney, J., “Driverless Uber in Pittsburgh Heightens Human/Machine Debate,” September 15, 2016. Next City, https://nextcity.org/daily/entry/uber-tests-self-driving-cars-pittsburgh-drivers, accessed October 22, 2016.
363 Zimmer, J., “The Road Ahead,” September 18, 2016, Medium, https://medium.com/@johnzimmer/the-third-transportation-revolution-27860f05fa91#.rb2goowgv, accessed January 7, 2017.
364 Bettencourt, L., “These Cities Could Lead the Driverless Car Revolution,” October 4, 2016, Fortune, http://fortune.com/2016/10/04/driverless-cars-uber-lyft-google-baidu/, accessed January 7, 2017.