Technical Memorandum
DATE: December 17, 2020
TO: Boston Region Metropolitan Planning Organization
FROM: Bill Kuttner
RE: Trucks at the Southampton Street Bottleneck
Activities of the Boston Region Metropolitan Planning Organization (MPO) Freight Program include:
The topical study prepared each year always has a primary focus, but inevitably has a number of relevant aspects, which might include:
All the themes listed above appear in this study, which will become apparent in the next section. The next section outlines the geography of the study area and presents four individual study topics. Complicating most of these themes is the daunting problem of congestion at the Southampton Street on-ramp, a problem that impacts all classes of traffic, and gives this study its name.
The focus on South Bay is especially timely this year for several reasons. The most important is that the regulations governing use of South Boston Bypass Road (Bypass Road) are being reconsidered. This study is not officially part of the regulatory review process, but the information and analyses are directly relevant. A Notice of Project Change (NPC) is expected to be filed with the Massachusetts Environmental Protection Agency by the Massachusetts Department of Transportation (MassDOT) in late 2020.
The review of this study location is also timely because the business complex at Widett Circle is actively considering relocating. The truck trip generation estimates developed in this study may be relevant in assessing traffic impacts on potential alternative locations.
The South Bay area is the closest concentration of industrial activity to downtown Boston at the heart of the Boston Region MPO area. The roadways studied here serve industries in the immediate vicinity, notably wholesale food distributors, and efficiently connect to other nearby industrial areas. These type of locations, where important regional routes pass through major industrial areas, have been important freight program study topics since the program’s inception in 2013. The central location of this study area presents some unique traffic management issues not usually seen at other freight study areas.
The study area provides a positive example of how truck traffic can be accommodated and managed. The Central Artery/Third Harbor Tunnel project (CA/T) envisioned modern infrastructure configured for the needs of local and regional logistic and heavy vehicle activity. One component of the CA/T, Bypass Road, was planned as a truck-only corridor to serve existing industrial and expanding commercial activities in the South Boston Waterfront.
These system elements have worked well, and the challenge today is to join these newer subsystems safely and efficiently with the much older Southeast Expressway section of Interstate 93 (I-93). The importance of these system elements is reflected in the incorporation in the National Highway Freight Network (NHFN).
The NHFN was established by federal highway funding authorization legislation to help prioritize a portion of federal highway funds to parts of the roadway system that are especially important for freight movement. The backbone of the NHFN is the Interstate Highway System, and this core network has been recently augmented with a set of locally designated routes, referred to as Critical Urban Freight Corridors (CUFC)1 .
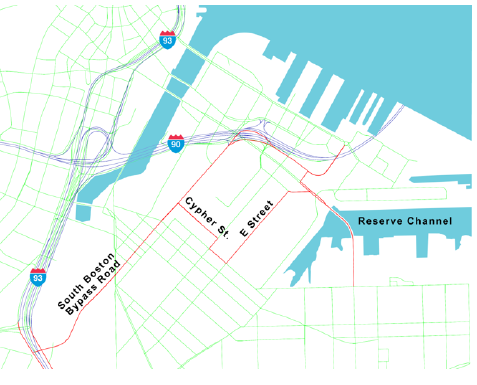
Some of the roadways serving the South Boston Waterfront were designated as CUFCs, and these are shown in Figure 1. The key CUFC segment shown in this figure is Bypass Road, which begins at a set of on- and off-ramps at I-93, the Southeast Expressway. Bypass Road extends north to the South Boston Waterfront area where it meets a set of ramps that connect with Interstate 90 (I-90) near the West Service Road Extension. Additional roadways serving nearby industrial and port areas were also designated as CUFCs.
Bypass Road was built in the 1990s as an early-action element of the CA/T project. It passes through a South Boston residential area in a reconstructed below-grade freight rail corridor (Figure 2). The rail corridor once had several tracks but now has only one track and shares the corridor with the two-lane Bypass Road. This corridor was used intensively by both trucks and trains to support CA/T construction. After the CA/T completion, it continued to be used with access limited to trucks, buses, and light commercial vehicles including taxis.
The Bypass Road use restriction was included in the federal and state environmental permitting documents. The restriction was relaxed on a temporary basis during reconstruction of the Callahan Tunnel, and the relaxed restrictions were allowed to continue as part of a pilot project to assess the feasibility of making the relaxed restrictions permanent. MassDOT considers the pilot phase a success and, with the submission of the NPC seeks to make these restrictions permanent by revising the 30-year-old environmental permitting documents.
The relaxed restrictions were intended to improve general traffic and access problems in the South Boston Waterfront, provided that the restrictions did not degrade commercial vehicle access. Any benefits to general traffic in the Waterfront were beyond the scope of this study, but the impact on trucks were evaluated.
A viaduct connects Bypass Road at its southern end with the complex of I-93 ramps and frontage roads, and these ramps and roadways, as shown in Figure 3, were the focus of this study. At this point, traffic can travel from Bypass Road to I‑93 in either the northbound or southbound directions. Conversely, vehicles on I-93 approaching from either the north or south can exit I-93 and reach Bypass Road. However, three of these four moves happen at ramps officially designated as Interchange 18, and the fourth move is at Interchange 16. To avoid confusion, the analysis presented here does not reference interchange numbers.
Figure 1
South Boston Waterfront
Legend
Interstate highways, intermodal connectors, and associated connecting ramps
Roadways recommended for CUFC designation and associated interstate highway access ramps
Roadways with a functional class of collector or higher
CUFC = Critical Urban Freight Corridors.
Source: Central Transportation Planning Staff.
Figure 2
South Boston Bypass Road Looking South
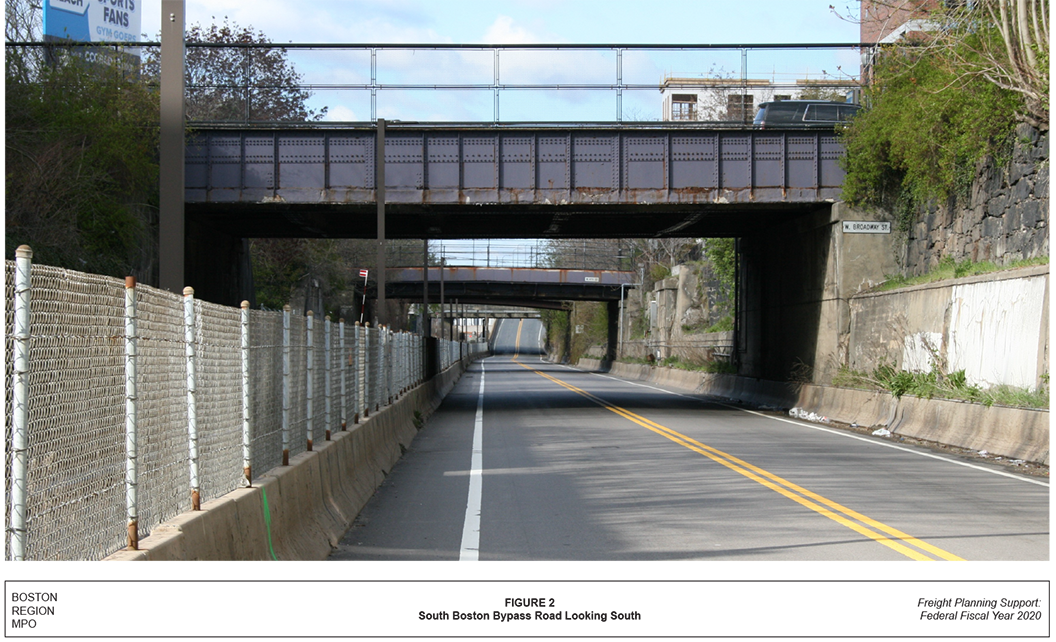
Figure 3
Study Area
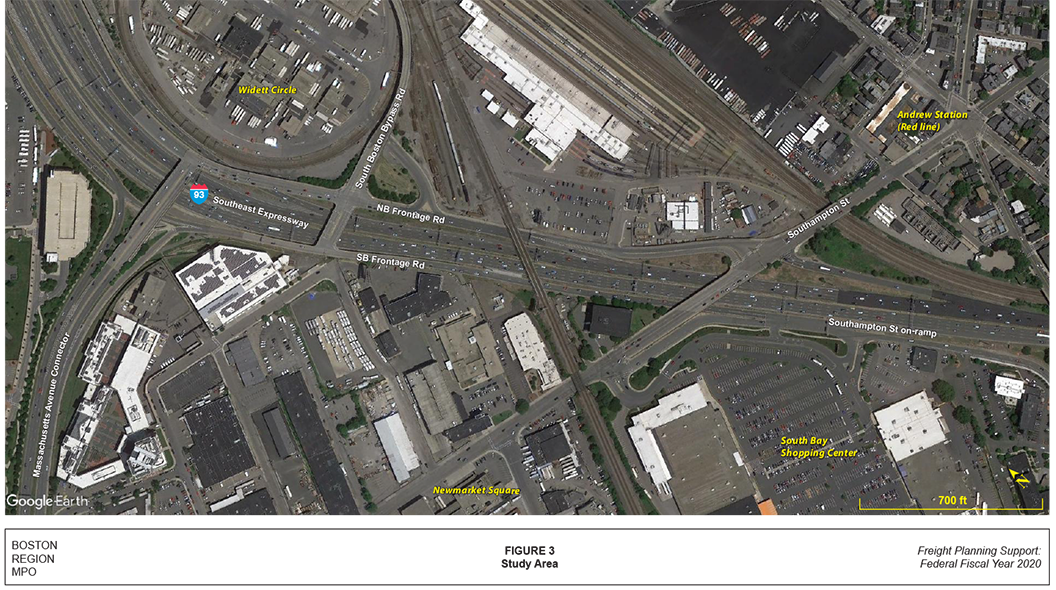
This area was chosen for study because it is the location of a major traffic bottleneck with impacts far more extensive than its immediate locale. The queues that develop behind the Southampton Street southbound on-ramp during a typical weekday PM peak impact Bypass Road traffic, and to some degree Bypass Road traffic impacts the queue. Both the Southeast Expressway and Bypass Road are part of the NHFN, and together made this location appropriate for MPO freight program study.
These data and analyses in this memorandum have been organized in four distinct but interrelated topics:
All traffic, including private autos, was counted and classified by vehicle type, time of travel, and direction of travel at the junction with I-93. Traffic volumes were compared with previous studies, and restrictions on vehicle use were reviewed.
The Widett Circle industrial area has only one entrance. Counting trucks at this entrance for an extended period provided an estimate of the total amount of truck traffic generated by its businesses. This could be an issue when planners consider the possible relocation of these businesses.
The location, extent, severity, and cause of this bottleneck were qualitatively reviewed. The relationship between this bottleneck and Bypass Road is discussed, as is a potential improvement under consideration.
Data collection for this study began in February 2020, before any mandated business closures, and ended on the last day of March when activity restrictions were severe. However, review of early and later truck traffic counts suggest that the counts remain useful in understanding most topics addressed in this study. The magnitude and pattern of truck traffic declines are briefly summarized.
As this study nears completion, traffic has begun to recover. The MPO intends to recount selected locations counted for this study in 2021, and updated findings related to the entire study are expected to be published in federal fiscal year 2021.
Traffic using Bypass Road was counted on four separate paths, and these are shown in Figure 4. Two paths leading away from the South Boston Waterfront are shown in red, and two paths leading to the South Boston Waterfront are highlighted in blue. These two path pairs diverge or converge at the pair of frontage roads paralleling I-93, where it meets Bypass Road.
The diverging red paths are referred to as going to the north or to the south. This is an oversimplification. Driving just 600 feet to the north a vehicle might turn west on Massachusetts Avenue Connector or continue north on either the frontage road or by entering I-93. Similarly, if a vehicle crosses I‑93 and makes a left turn on the other frontage road, it will be heading south, but the vehicle can also shortly turn to any number of nearby destinations. The partition of observed traffic into flows to the north and to the south has meaning only for the first turn decision where Bypass Road meets I-93.
The blue paths showing traffic converging towards the South Boston Waterfront are also labeled as from the north or from the south. Similarly, these labels refer only to the convergence point, and each of the two paths can collect traffic from many origins.
Traffic that was recently observed using Bypass Road is summarized in Table1. Table 1 has six columns of data that are arranged as three pairs of roughly reciprocal paths. In each pair of columns, the left-hand column shows traffic flowing in a generally southbound direction, and the right-hand column shows the corresponding northbound volumes. The first pair of columns are all vehicles traveling south from the Waterfront on Bypass Road and the reciprocal flow north towards the Waterfront. The second pair of columns is traffic collected on the southbound frontage road and traffic turning from Bypass Road toward the north. The third pair of columns is traffic turning from Bypass Road toward the south and traveling north to reach Bypass Road.
Traffic volumes in Table 1 are shown for four three-hour time periods for 12-hours total. The AM period is between 6:00 AM and 9:00 AM, and corresponds to the period used in the travel demand model. The PM period is between 3:00 PM and 6:00 PM and is also used as a standard model time period. The model also uses a six-hour midday period between 9:00 AM and 3:00 PM. This has been split into two three-hour periods to better illustrate the trends of traffic volumes over the 12 hours. These analyses are limited to these 12-hours because truck traffic is strong in the morning and through the midday, and then drops dramatically during the PM peak.
Figure 4
South Boston Bypass Road Junction with Interstate 93
.png)
Table 1
Traffic on South Boston Bypass Road
Vehicle Type |
Time Period |
Total from Waterfront |
Total to Waterfront |
From North |
To North |
To South |
Trucks and light commercial vehicles |
AM |
219 |
383 |
85 |
87 |
132 |
Trucks and light commercial vehicles |
MD1 |
260 |
440 |
104 |
114 |
146 |
Trucks and light commercial vehicles |
MD2 |
266 |
368 |
88 |
126 |
140 |
Trucks and light commercial vehicles |
PM |
120 |
184 |
34 |
60 |
60 |
Trucks and light commercial vehicles |
12-hour |
865 |
1,375 |
311 |
387 |
478 |
Taxis, vans, and buses |
AM |
8 |
42 |
10 |
2 |
6 |
Taxis, vans, and buses |
MD1 |
12 |
26 |
2 |
2 |
10 |
Taxis, vans, and buses |
MD2 |
10 |
44 |
10 |
4 |
6 |
Taxis, vans, and buses |
PM |
32 |
68 |
14 |
20 |
12 |
Taxis, vans, and buses |
12-hour |
62 |
180 |
36 |
28 |
34 |
Private autos |
AM |
86 |
836 |
324 |
35 |
51 |
Private autos |
MD1 |
80 |
458 |
160 |
38 |
42 |
Private autos |
MD2 |
176 |
816 |
274 |
58 |
118 |
Private autos |
PM |
196 |
682 |
196 |
110 |
86 |
Private autos |
12-hour |
538 |
2,792 |
954 |
241 |
297 |
Total vehicles |
AM |
313 |
1,261 |
419 |
124 |
189 |
Total vehicles |
MD1 |
352 |
924 |
266 |
154 |
198 |
Total vehicles |
MD2 |
452 |
1,228 |
372 |
188 |
264 |
Total vehicles |
PM |
348 |
934 |
244 |
190 |
158 |
Total vehicles |
12-hour |
1,465 |
4,347 |
1,301 |
656 |
809 |
Note: AM refers to 6:00 AM to 9:00 AM, MD1 to 9:00 AM to noon, MD2 to noon to 3:00 PM, and PM to 3:00 PM to 6:00 PM.
Source: Central Transportation Planning Staff.
The traffic counts in Table 1 have been organized by three groups of vehicles. The first group is trucks and commercial vehicles, the focus of this study. Trucks in this instance refers to non-passenger vehicles with six or more wheels and are generally subject to heavy vehicle prohibitions on parkways and certain other streets. In the most common six-wheel configuration, the rear wheels are doubled. Light commercial vehicles are four-wheeled vehicles that are allowed to use the entire network. These vehicles are often indistinguishable from a family car, except that the vehicle will usually have a business name stenciled on the side.
The other two groups are taxis, passenger vans, and buses, which have always been allowed the use Bypass Road, and private autos, which have more recently been allowed some access to Bypass Road. Totals of the three groups are shown at the bottom of Table 1.
Traffic using Bypass Road was counted in December 2013 and March 2014, just before and during a planned Callahan Tunnel closure. The truck volumes in Table 1 are about 13 percent more than the December 2013 count, and about the same as the March 2014 count.
One of the most notable characteristics of Bypass Road is the directional imbalance with far more vehicles of every type traveling to the Waterfront than away. Trucks have the smallest imbalance with 1,375 trucks going to the Waterfront, which is only 59 percent more than the 865 leaving. However, the imbalance is concentrated in the trucks using Bypass Road from the south: 1,064 compared to only 478. This imbalance persists throughout the day.
The cause of this imbalance is not obvious. Access to the South Boston Waterfront from I-93 at the start of Bypass Road is provided by a pair of lengthy ramps connecting I-93 directly with Congress Street in the heart of the Waterfront’s business district. Bypass Road also provides access to the business district, but allows convenient entrance to the industrial areas to the south of the business district. Many trucks traveling from and to the south may prefer to enter the industrial areas first, and then leave via the Waterfront I-93 entrance ramp or after serving a customer in Boston’s downtown business district enter I-93 at one of the downtown entrance ramps.
The simplest explanation for this reluctance to use Bypass Road in the southbound direction is that it requires passing through two additional signalized intersections on the southbound frontage road before reaching the I-93 entrance. Peak period congestion patterns in the Waterfront business district have little influence on this imbalance, because the imbalance also happens when there is no congestion.
The truck flows to and from the north on Bypass Road are more closely balanced with each other. Turning to the north is an oversimplification because about a third of trucks on Frontage Road immediately make a left turn onto Massachusetts Avenue Connector, a key route to points west, including the Longwood Medical Area. About a quarter of the trucks enter I-93, and the remaining trucks continue on Frontage Road. However, Frontage Road traffic at this point contains vehicles from Bypass Road, Widett Circle, the I-93 exit ramp, and Southampton Street. The turns by Bypass Road trucks were not observed directly.
Only 60 trucks leave Bypass Road headed south during the PM peak period. Most of these vehicles join the queue at the Southampton Street bottleneck, which is discussed in a following section.
Taxis, commercial passenger vans, and buses make up less than five percent of Bypass Road traffic. These data are presented here because these vehicles have always been allowed unrestricted use of Bypass Road. Volumes of these vehicles have changed little since the December 2013 counts.
Freelance drivers carrying or meeting passengers for Transportation Network Corporations could not be identified, and in the recent counts were counted with the private autos. These services did not exist in 2013.
These vehicles show an even more pronounced directional imbalance than the trucks. Also, some buses carried no passengers, reflecting the fact that there are several motor pools and maintenance depots located convenient to the Bypass Road corridor.
Bypass Road was built with the original CA/T agreement that it would only be used by commercial vehicles. There had long been a concern about the viability of businesses in the working waterfront and nearby industrial areas due to access concerns. A large amount of nonindustrial growth was envisioned, and there was a fear that increased traffic would make it harder for local small businesses and light industry to compete. Bypass Road and the new I-90 ramps made the South Boston Waterfront accessible to the region, but Bypass Road was to be exclusive to trucks, buses, and other commercial vehicles.
Industrial activity and the associated truck traffic have remained strong during this period of redevelopment. The Paul W. Conley Container Terminal, operated by the Massachusetts Port Authority, has expanded as its business has grown steadily, and new businesses have opened at the Raymond L. Flynn Marine Park (formerly the Boston Marine Industrial Park). Also offices, restaurants, and the hospitality industry, including the Boston Convention and Exhibition Center, generate a significant number of truck trips.
Despite a continued need for large numbers of trucks to get in and out of the South Boston Waterfront, Bypass Road (when limited to commercial vehicles) always operated well below capacity. As traffic growth in this area puts increased pressure on the local road system, the complete opening of Bypass Road to private autos is seen as a simple and expedient way to accommodate the steady traffic growth.
The closing of Callahan Tunnel for reconstruction of its interior systems in 2014 required adaption of the existing network, and parts of Bypass Road were opened to private vehicles. Private autos were allowed to use Bypass Road from I-93 towards South Boston Waterfront (northbound), but not in the direction towards I-93 (southbound). This continued prohibition was considered necessary because any traffic increase on Bypass Road southbound during the PM peak would exacerbate the problem of the bottleneck at the Southampton Street on-ramp.
The northern end of Bypass Road between Cypher Street and I-90 (Figure 1) became completely unrestricted when some mixed-use developments near Cypher Street were approaching completion. Bypass Road accommodated traffic during the Callahan Tunnel project with the eased restrictions, and after completion of the Callahan project, the limited restriction system was allowed to continue.
Data from Table 1 shows that private autos have the greatest directional imbalance, with 2,792 traveling to the Waterfront and 538 traveling towards I-93. This imbalance can be fully explained by the fact that private autos are actually prohibited from traveling towards I-93, and the 538 cars either did not notice one of the signs or decided to take a chance. Signage appears to be part of the problem, and this is discussed in the next section Also, traffic in the legal direction is steadier over the course of the day than travel in the illegal direction that builds to its peak during the problematic evening rush hour.
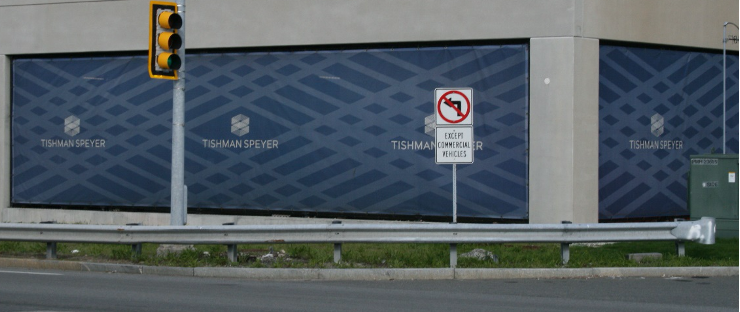
Vehicle restrictions are communicated to drivers by signs. Recent photos of three relevant sign conditions are shown in Figure 5. The first sign is located near I‑93 and announces that any vehicle may use Bypass Road to travel north to the Waterfront. The second sign indicates the Bypass Road restriction in the direction towards I‑93. Unfortunately, this sign is not located at the Bypass Road entrance, but almost halfway to I-93.
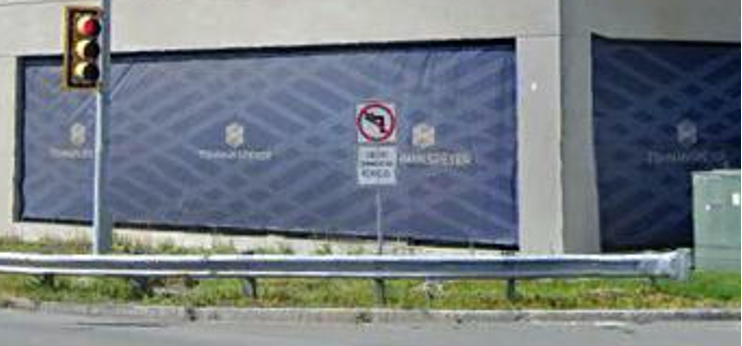
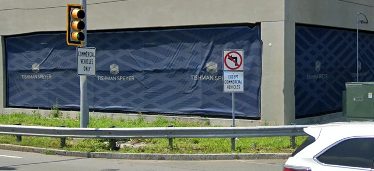
The third photo in Figure 5 shows sign-mounting hardware affixed to the traffic signal at the Cypher Street entrance to Bypass Road. This traffic signal also appears in Figures 6, 7, and 8, which show the same intersection at three points in time. All three images show a no-left-turn sign telling Cypher Street traffic not to enter Bypass Road unless the vehicle is commercial. The photos from May 2020 and September 2019 do not have a sign facing the main southbound flow of Bypass Road traffic. The sign was clearly visible in June 2019.
Figure 5
Bypass Road Signage Examples
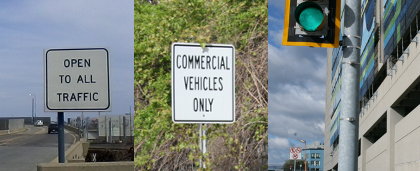
Sources: Central Transportation Planning Staff, GoogleEarth
Bypass Road is patrolled by the Massachusetts State Police and a trooper was conducting an enforcement action during a recent field count. The trooper discussed his Bypass Road enforcement practices, offering that after waving over a number of private autos, he generally educates the driver of the infraction and gives a warning. A quick tour of the route in the patrol vehicle revealed the signage problem. He said that sometimes a violator will see a sign partway along Bypass Road and make a hasty three-point turn to avoid a possible ticket, something clearly unsafe in the narrow Bypass Road corridor.
Figure 6
Sign at Cypher Street, May 2020
Source: Central Transportation Planning Staff
Figure 7
Sign at Cypher Street, September 2019
Source: GoogleEarth
Figure 8
Signs at Cypher Street, June 2019
Source: GoogleEarth
Widett Circle is one of two streets within a small industrial park in the study area. Most of the businesses on Widett Circle and Foodmart Road are members of the cooperatively owned New Boston Food Market, and almost all are in the business of distributing mostly perishable food. This area is usually referred to as Widett Circle.
All access to Widett Circle businesses and a nearby commuter rail maintenance facility is via a single, short two-way connecting road from northbound Frontage Road, which is shown in Figure 4 with its outbound lane highlighted. Trucks, including light commercial vehicles, were counted leaving Widett Circle for the 12-hour period of interest of this study, and results of these counts are summarized in Tables, 2, 3, and 4. With only one access point, the number of vehicles entering Widett Circle equal the same number of vehicles leaving. Private autos were not counted as part of this study, but many workers were seen walking to and from the Red Line at Andrew Station.
The 12-hour total of trucks leaving Widett Circle was 540. Trucks from Widett Circle and trucks using the frontage road connection were subdivided into eight easily identifiable trucks types, and these data are summarized in Table 2. The 540 trucks from Widett Circle represent only 19 percent of the total frontage road trucks that arrive at the nearby Bypass Road intersection. The largest group of vehicles are refrigerated trucks: 216 single-unit and 102 semi-trailers. The refrigerated trucks from Widett Circle outnumber the same trucks on the frontage road. Many of the 128 light commercial vehicles are also refrigerated, but these were not counted separately.
The box trucks classified look like refrigerated trucks but have no refrigeration unit. There are no terminals at Widett Circle specializing in merchandise, and from the markings, many of the box trucks appear to be delivering packaging material. Trucks classified as other in the study were a very diverse group, including garbage trucks and chassis used for hauling ocean containers, some of which are stored at Widett Circle. The trucks classified as hazardous cargoes were commuter locomotive fuel and fuel for some of the refrigerated trailers and truck tractors.
Table 3 shows truck departures from Widett Circle over the course of the day. The afternoon drop-off from 128 to 38 in the two afternoon periods was much steeper than the 368 to 184 truck drop-off on Bypass Road. Table 4 shows the general direction that Widett Circle trucks were headed. Trucks continuing north on the frontage road may have been taking it into downtown, entering I‑93 northbound, or turning left onto Massachusetts Avenue Connector. Most turning to the south were entering I-93.
Table 2
Trucks Leaving Widett Circle by Type
Vehicle Type |
Trucks leaving Widett Circle |
Percent of Similar Frontage Road Trucks |
All truck types |
540 |
19 |
Light commercial vehicles |
128 |
11 |
Box trucks: single-unit |
22 |
9 |
Box trucks: semi-trailer |
30 |
11 |
Refrigerated: single-unit |
216 |
54 |
Refrigerated: semi-trailer |
102 |
54 |
Other configurations: single-unit |
34 |
8 |
Other configurations: semi-trailer |
6 |
10 |
Hazardous cargoes |
2 |
17 |
Source: Central Transportation Planning Staff.
Table 3
Trucks Leaving Widett Circle by Time Period
Time Period |
Trucks leaving Widett Circle |
Percent of 12-Hour Total |
12-hour |
540 |
100 |
6 AM to 9 AM |
180 |
33 |
9 AM to noon |
194 |
36 |
Noon to 3 PM |
128 |
24 |
3 PM to 6 PM |
38 |
7 |
Source: Central Transportation Planning Staff.
Table 4
Trucks Leaving Widett Circle by Travel Direction
Travel Direction |
Trucks leaving Widett Circle |
Percent of 12-Hour Total |
All directions |
540 |
100 |
Right turn to Bypass Road |
144 |
27 |
Continue north on Frontage Road |
194 |
36 |
Turn to southbound Frontage Road |
202 |
37 |
Source: Central Transportation Planning Staff
Vehicles using Bypass Road and serving Widett Circle access region-wide origins and destinations via I-93. The I-93 ramps to and from the north were constructed as part of the CA/T project completed in the early 2000s. The CA/T added substantial capacity in the central part of the regional express highway system, and today, congestion problems are experienced more at the edges of the CA/T project area where it connects with older parts of the regional express highway network. Of course, congestion at these outlying locations can severely impact traffic flow within the newer CA/T roadways; however, the solutions to congestion problems will require improvements at these outer parts of the network.
Bypass Road regional traffic to and from the south will need to use the Southeast Expressway portion of I–93. This road was built in the 1950s as a six-lane freeway with breakdown lanes. In the 1980s, the breakdown lanes were rebuilt as managed lanes, allowing travel during peak periods. By the early 1990s, the Southeast Expressway was an eight-lane freeway with a limited number of turnouts for breakdowns.
The study area shown in Figure 3 is the transition section between the CA/T roadways and the older Southeast Expressway. From the perspective of traffic flow, the transition between these two regional roadway subsystems takes place at the Southampton Street on-ramp, which adds 19,000 weekday vehicles from Southampton Street, South Bay Center, Bypass Road, Massachusetts Avenue Connector, and Albany Street to the 97,000 weekday vehicles already on I‑93 coming from the north.
Traffic volumes on I‑93 and the two ramps that connect Bypass Road with the south are summarized in Figure 9. The data in Figure 9 has been arranged in 10 tabular columns, five for southbound and five for northbound traffic. Between these groups of columns is a schematic of the main I‑93 highway lanes and the two ramps that connect with Bypass Road, and these data have been grouped to correspond with the schematic.
North is at the top of Figure 9 and south is at the bottom. Southbound traffic enters at the Southampton Street on-ramp. There is a corresponding northbound Southampton Street off-ramp, but it is not a concern of this study because Bypass Road traffic exits at the next, Frontage Road exit. There are no traffic problems at this location going from the Southeast Expressway north into the CA/T system. However, trucks and light commercial vehicles were counted in the northbound direction to support the study of Bypass Road and Widett Circle.
The total vehicle estimates for average weekday traffic (AWDT) and the travel demand model time periods were developed by the Boston Region MPO in 2018, based on the most recent and reliable traffic count data at that time. The vehicle counts labeled other are the totals of trucks and light commercial vehicles that were counted for this study. Total passenger vehicles were derived by subtracting the recently counted trucks and commercial vehicles from the total traffic. Taxis, vans, and buses were not counted separately at the Table 5 locations, and are included with passenger vehicles.
The ebb and flow of peak daily traffic can be seen in Figure 9, starting with morning northbound traffic to downtown Boston. All three of the northbound roadway sections summarized to the right of Figure 9 carry the heaviest traffic load, both passenger and non-passenger, during the AM peak period. These volumes steadily decline during each of the three subsequent three-hour periods. Truck traffic decreases slowly during the midday, and then drops sharply during the PM peak. Trucks as a percent of traffic peak between 9:00 AM and noon, defined for this study as the MD1 three-hour period.
Southbound traffic mirrors northbound traffic in some respects. On the I‑93 southbound main barrels, total traffic and passenger vehicles are lowest during the AM peak and then steadily increase over the next nine hours. Truck volumes start weak, increase for six hours, and then decrease during the PM peak to a level actually lower than AM peak. Trucks as a percent of traffic peak between noon and 3:00 PM, defined for this study as the MD2 three-hour period.
Two aspects of the Southampton Street entrance numbers in Figure 9 are especially relevant to this study:
Traffic on this ramp does not decline because fewer drivers want to use this entrance. It goes down because traffic on I-93 has increased and will not accept all the vehicles trying to merge from this entrance. Traffic waiting to enter I‑93 forms a lengthy queue system behind the entrance ramp, as shown in Figure 10.
Figure 9
I-93 Traffic at South Boston Bypass Road Connecting Ramps
.png)
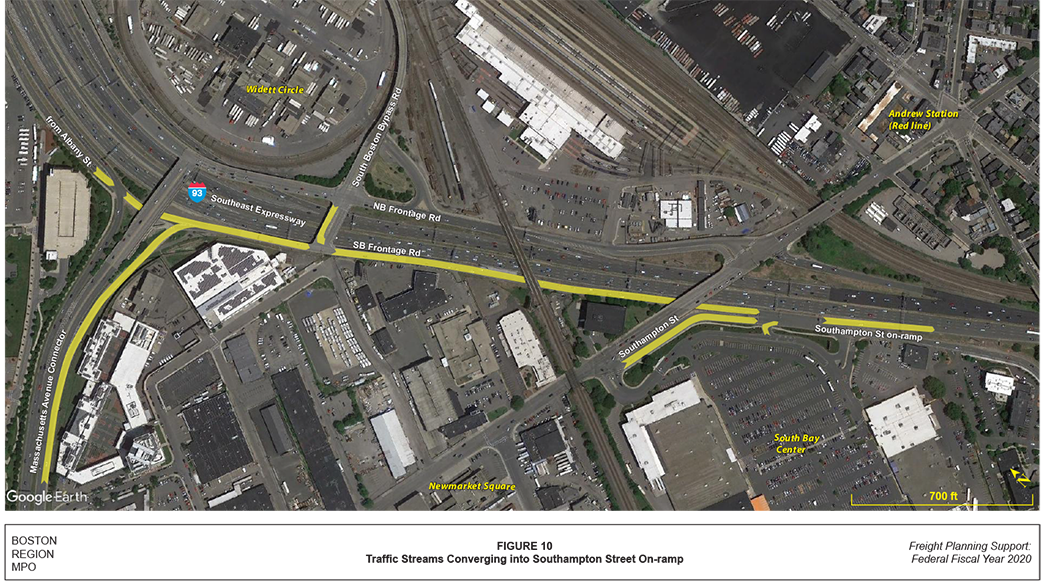
Figure 10
Traffic Streams Converging into Southampton Street On-ramp
The cause of the PM peak Southampton entrance queue can be illustrated with some of the numbers from Figure 9. During the MD2 three-hour time period, 16,600 vehicles approached the Southampton entrance merge on I‑93 and were joined by 3,850 vehicles entering at the ramp, making a total of 20,450. The entering traffic happened to be 19 percent of the combined total. Queues were normally not seen during this time period and the relative size of the combining traffic flows can be assumed to have been the result of the underlying travel demand during the period.
During the PM peak, the number of vehicles that approached the Southampton merge on I‑93 increased by 1,200 to 17,800, and joined a slightly diminished 3,700 entering vehicles for a total of 21,500 after the merge. This volume represents a maximum practical capacity at this location given the traffic and roadway configuration of the southbound I‑93 system. In these conditions, only 17 percent of the traffic after the merge came from the entrance ramp. The excess traffic wishing to use this entrance during this period must wait in the extensive queue system.
The traffic flows that converged to enter I-93 at the Southampton Street on-ramp are highlighted in Figure 10. The queue branches passed through or approached several signalized intersections, which are also indicated in Figure 10. Queues were not observed during this study because public health-related business closures had greatly reduced private auto traffic throughout the region. However, this queue system was a significant factor in a 2012 Boston Region MPO study, and key findings of that study remain valid and relevant to this analysis.2
The longest branch of this queue system extends back onto Massachusetts Avenue Connector. In the 2012 study, the back of the queue was about 200 yards away from the intersection of Massachusetts Avenue and Melnea Cass Boulevard, the major arterial traffic nexus in this part of Boston. Vehicles at the end of the queue were tracked the 0.8 miles to the Southampton Street entrance merge point. This queue required 24 minutes to travel this distance, moving at an average speed of two miles per hour.
At about the midpoint of this branch of the 2012 queue, the queue met Bypass Road traffic at a signalized intersection. This signal provides enough green time for traffic from Bypass Road and Widett Circle to enter the queue. Only about 172 vehicles enter the queue here during the PM peak period: 60 trucks, 12 taxis, vans, and buses, and 86 presumably unauthorized private autos (from Table 1). There are also about 14 trucks from Widett Circle (derived from Tables 3 and 4).
The 172 vehicles entering the queue at the Bypass Road signal during the three-hour PM peak period does not significantly slow the movement of the queue. This number is small because trucks tend to concentrate travel in the earlier parts of the day and the Bypass Road private auto restriction is respected by most drivers.
If use of Bypass Road were unrestricted and the number of vehicles trying to enter the queue at this intersection increased significantly, keeping the current signal timing would result in traffic backing up onto the Bypass Road viaduct. Currently, a slight majority of Bypass Road traffic wants to make a right turn and go north to either I-93 or a local destination. These vehicles would then be stuck on the Bypass Road viaduct in the lengthened Southampton Street queue branch.
If the signal timing were changed to allow more traffic to enter the queue from Bypass Road, fewer vehicles could be accommodated from Massachusetts Avenue Connector. In normal traffic conditions, this queue already extends too close to Massachusetts Avenue, and loss of green light time on the frontage road could seriously impede traffic flow at the Massachusetts Avenue intersection.
There is also second signal before the frontage road traffic can enter I‑93. This signal regulates converging traffic from three approaches: the frontage road, Southampton Street, and the South Bay Center retail complex. The entrance originally served only Southampton Street. South Bay Center was built in the 1980s at the site of a utility motor pool, and the frontage road was built as part of the CA/T. During the PM peak, 54 percent of trucks entering I-93 come from the frontage road.
If traffic exceeds the capacity of available roadways to accommodate it, queues will form. They can be moved around and managed, but shrinking or eliminating queues requires adding capacity or perhaps finding some underutilized capacity that can be pressed into service. Options to deal with the Southampton Street bottleneck need to be analyzed in the context of the volumes and capacities leading into and away from the problematic merge. Using the limited available data and no engineering analysis, this section outlines several general approaches that might lessen the queue problem at this location.
The PM peak bottleneck section of southbound I-93 is shown schematically in Figure 11 with the total three-hour volumes for the ramps and I-93 segments indicated. Managing or reducing the Southampton Street on-ramp queues requires managing the volumes shown in Figure 11. Three actions that impact queue lengths are also discussed in this section.
As described above, more private autos would use Bypass Road to reach I-93 if it were not for the prohibition. The autos deterred by the prohibition do not disappear, rather, the vehicles enter the express highway system at an entrance ramp in South Boston Waterfront or perhaps near South Station. At some point, the vehicles merge into the I-93 southbound mainline, and during the PM peak become part of the 17,800 vehicles working slowly through the extended mainline queue, as shown in Figure 11.
The total of 21,500 peak-period vehicles can be considered a practical maximum capacity for this segment of I-93, and the 3,700 versus 17,800 split reflects the ability of entering traffic to merge into the four mainline lanes. Any actions to manage the two queue systems approaching will only affect how far back the queues extend from the merge point.
This fact points to the overriding reason for limiting the use of Bypass Road. The queue system that builds on I-93 has four lanes that can store congested traffic, and in most evening peak periods, the entrance ramps in the downtown area will not completely fill. Peak period queues extending from the entry point of an on-ramp can stretch back into local street systems, creating any number of traffic flow and safety problems.
The 172 vehicles from Bypass Road and Widett Circle entering the PM peak queue at this point are only a small part of the queue’s volume. With better signage and enforcement, the 86 private autos now using Bypass Road could be reduced and the queue shortened slightly. Banning trucks would also shorten the queue but this would defeat the purpose of Bypass Road. Any logistic service whose itinerary requires travel during the PM peak will waste substantially less vehicle and staff time getting out of South Boston Waterfront with the availability of Bypass Road.
Figure 11
I-93 PM Peak Period Southbound
Total Traffic between 3:00 PM and 6:00 PM

There are four lanes in the section of I-93 that carry 21,500 vehicles during the PM peak period, an average of 5,375 vehicles per lane. This four-lane segment is fed traffic from five lanes: 17,800 vehicles from the four-lane mainline and 3,700 from the Southampton Street entrance. Each of the four approaching mainline lanes carries an average of 4,450 vehicles during the period.
If the combined 21,500 vehicles in the bottleneck were divided evenly among the five approaching lanes, each lane would carry 4,300 vehicles during the period. This would represent an increase of 600 vehicles for the Southampton Street entrance and a decrease of 150 for each of the four approaching mainline lanes. This would shrink the Southampton Street queue system and lessen the chance that a queue might back up all the way through Massachusetts Avenue Connector. The reduction in mainline traffic would, however, result in some lengthening of the highway queue system leading to the merge.
The Southampton Street on-ramp acceleration lane is only 300 feet long, reflecting design standards of the 1950s. With congested conditions, entering vehicles must slow down, wait for a gap in traffic and accelerate, resulting in the entering lane handling fewer vehicles than the average mainline lane. With a longer acceleration lane, entering traffic can match the speed of mainline traffic and then change lanes.
A proposal that has been studied by both MassDOT and the Boston Transportation Department would add a fifth, auxiliary lane extending from the Southampton Street entrance to the Columbia Road off-ramp one-half mile away, as shown in Figure 11. A distance of 1,000 feet is a standard for allowing a lane change, and with a full half-mile to effect a merge, the amount of traffic entering at Southampton Street would be able to increase. The auxiliary lane could be built within state-owned land but would require reconstruction of the Boston Street and Dorchester Avenue bridge abutments between Southampton Street and Columbia Road.
The proposed auxiliary lane would increase the share of bottleneck traffic that could enter I‑93 at the Southampton Street ramp, but it would not increase the total amount of traffic that could flow through the bottleneck. Figure 11 also shows that the endpoint of the auxiliary lane, the Columbia Road off-ramp, offers no relief capacity because slightly more PM peak-period vehicles enter I‑93 at Columbia Road than leave.
Once traffic waiting in the queue gets into the bottleneck section, traffic flow improves. This is largely because a fifth southbound lane is available during the PM peak that is available for buses and carpools traveling all the way to the Braintree Split. This lane, commonly referred to as the Zipper Lane, can be repositioned and on weekdays is set up to allow five inbound lanes during the AM peak, and then is repositioned to provide five southbound lanes during the PM peak.
If an additional southbound lane were available for the entire 1.5 miles between the Southampton Street entrance and the start of the Zipper Lane, the number of vehicles traveling through the bottleneck could increase substantially. This added mainline capacity would shorten both the on-ramp and mainline queue systems that form behind the Southampton Street merge.
Adding some type of lane for the entire 1.5-mile distance would be costly and complex, most likely requiring some combination of land takings and rail line relocation. An optimal solution might involve connecting the Zipper Lane operation with existing high-occupancy vehicle lanes that were built as part of the CA/T project. The 2012 Southeast Expressway study cited aboverecommended adding both the auxiliary lane and a new reversible lane that would connect the CA/T and Zipper Lane high-occupancy vehicle facilities.
Data collection for this study began in late February 2020, and concluded on the last day of March. During this interval, restrictions on business activity were gradually mandated to ensure widespread social distancing that would slow the spread of the COVID-19 virus. By mid-April, fewer than half the usual number of private autos were on the roads.
A tightened definition of what would be considered an essential business also reduced truck traffic. Total traffic counts from this period were clearly not usable, but with many trucks in the study area serving essential industries, it was possible that even with some truck traffic decline the data might be appropriately used for this study. This section shows the analysis that deemed the gathered truck data to be usable, and in the process gives an initial estimate of the impact of the business closures on truck volumes.
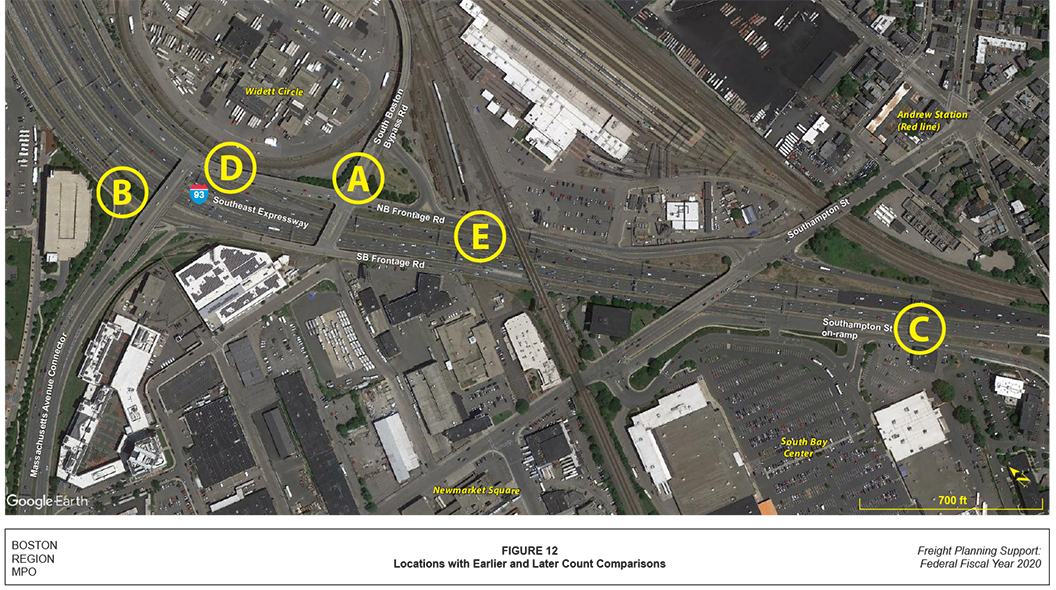
Relevant count comparisons are summarized in Table 5. Counts were performed at each location for three or four distinct traffic flows that could be observed at once. The vehicle counts in Table 5 are for all of the counted traffic flows at each location combined. The locations where the counts took place are shown in Figure 12.
The locations are listed in descending order of severity of the traffic impact of the business closures. Although the focus of the study was trucks and light commercial vehicles, private autos and buses were counted on South Boston Bypass Road in order to evaluate use restrictions. The first line lists the vehicle type as passenger and includes private autos, shuttle vans, and buses on Bypass Road. The second line list vehicles as other, meaning all trucks and light commercial on Bypass Road. The remaining five comparisons, labeled as other, are also trucks and light commercial vehicles.
Count times are shown as either early PM, noon, or late AM. Early PM means that there were two counts during some period between noon and 3:00 PM. Noon implies that there were two counts closely clustered around midday, and late AM means two counts between 9:00 AM and noon.
In most instances, each three-hour period would have two 45-minute counts performed on different days and at two different 45-minute blocks within the three-hour period. Adding the volumes from the two 45-minute counts together, and then multiplying the 90-minute total by two gave an estimate of vehicles for the entire three-hour period. This is how three-hour truck volumes were estimated for Tables 1 through 4, and how bus and auto volumes were estimated for Table 1. However, the volumes in Table 5 have been calculated for one-hour instead of three-hour periods.
Truck traffic tends to be relatively stable between 9:00 AM and 3:00 PM, before dropping off steeply between 3:00 PM and 6:00 PM. The seven locations and time periods listed in Table 5 had the two counts done sufficient days apart that it was possible to measure a volume decline largely attributable to mandatory business closures. The two counts between noon and 3:00 PM at Location A on Bypass Road were performed ten days apart on March 6th, and 16th. The counts at Location E were performed between 9:00 AM and noon on February 26th, and March 18th, an interval of 21 days.
The greatest percent decrease in traffic was on Bypass Road. Passenger vehicles reduced by more than half, reflecting the widespread business closures. Trucks and light commercial vehicle decreased 26 percent. The lower level of Bypass Road traffic can also to some degree be attributed to the fact that with less traffic within the South Boston Waterfront, using the interstate ramps to connect with Congress Street becomes comparatively more useful for some trips.
Table 5
Public Health-Related Traffic Decreases
Map Key |
Count Location |
Type Vehicles |
Time |
Earlier Counts Vehicles |
Earlier Counts Date |
Later Counts Vehicles |
Later Counts Date |
Percent Change |
A |
Bypass Road |
passenger |
early PM |
477 |
March 6 |
220 |
March 16 |
-54 |
A |
Bypass Road |
other |
early PM |
243 |
March 6 |
180 |
March 16 |
-26 |
B |
Interchange 18 southbound exit |
other |
noon |
315 |
March 5 |
270 |
March 20 |
-14 |
C |
I-93 southbound |
other |
noon |
946 |
March 11 |
839 |
March 25 |
-11 |
D |
Interchange 18 northbound entrance |
other |
late AM |
203 |
March 11 |
196 |
March 20 |
-3 |
E |
I-93 northbound |
other |
late AM |
712 |
February 26 |
712 |
March 18 |
0 |
D |
Interchange 18 northbound entrance |
other |
early PM |
133 |
March 6 |
138 |
March 20 |
4 |
NA |
Combined Other Vehicles |
NA |
NA |
2,552 |
NA |
2,335 |
NA |
-9 |
Note: NA refers to not applicable.
Source: Central Transportation Planning Staff
Figure 12
Locations with Earlier and Later Count Comparisons
The other five comparisons are for counts made at four locations. Comparisons for both AM and PM truck traffic were made at Location D, a group of traffic flows near the northbound Interchange 18 entrance to I-93. Volume changes at these locations range from a decrease of 14 percent to an increase of four percent. The small increase at Location D roughly matches the three percent decrease at this location during the AM.
The combined totals of trucks and commercial vehicles for the six comparison locations show a decrease of nine percent. If the earlier count dates represented normal levels of truck traffic and the later counts represented a low point, then the overall decline in this portion of the regional road network might be between four and five percent. However, it is only possible to speculate on the position of these counts in a period of truck traffic decline, which is fundamentally different from the passenger vehicle decline.
Many of these data in this study are presented to describe patterns of truck movements, and these patterns would still be apparent with a shortfall of this limited magnitude. The actual numbers of trucks leaving Widett Circle was a key finding of this study, but with most of these trucks carrying perishable food rather than merchandise, the drop in the truck counts may be considered moderate.
A general reduction in traffic will not reduce traffic uniformly across the road system. For instance, in the Bypass Road example above, traffic reduction in or near other convenient alternative ramps may make the drop in Bypass Road traffic greater than the average decrease. Conversely, traffic on I-93 may have declined less than average if traffic that would normally use the I-95/Route 128 circumferential corridor found that with the traffic decrease, it was faster to take I‑93 through downtown Boston.
Trucks, comprising non-bus heavy vehicles and light commercial vehicles, have received most of the study attention of the MPO’s Freight Program. Trucks share the long-distance movement of goods and commodities with highly efficient rail, maritime, and air cargo networks. But trucks also complement these long-distance freight modes in almost all instances by providing the critical link between a rail, air, or water terminal and transportation customers.
The Freight Program has quantified very large numbers of trucks characterized as working vehicles that are not engaged in freight transportation. These are usually configured with mechanical systems to perform specialized tasks, such as collect garbage or blend ready-mix concrete. Many box-shaped trucks are actually honeycombed with locked compartments for tools and materials required on-site by contractors. These working vehicles and light commercial vehicles are invisible in national freight-flow statistics.
Trucks share the roadway system with passenger vehicles, and the strengths and deficiencies of this network are usually experienced by all classes of vehicles. Trucks must adapt travel itineraries to avoid truck-restricted roadways and locations with height or weight restrictions that might apply. The roadway deficiency addressed in this study was severe peak-period congestion that impacts all types of vehicles, both within and outside the defined study area.
The roadway system in the study area was actually optimized for truck traffic. Much of this memorandum simply describes how trucks, many serving important local industrial sites, take advantage of the connectivity options available. Most of the roads, ramps, and highways described here are designated components of the National Highway Freight Network and were built to modern standards as part of the CA/T project.
One of the findings of this study was that trucks are not a major factor one way or the other in the severe PM peak congestion. The study does, however, analyze several aspects of the PM peak-traffic problem.
Use of Bypass Road was unrestricted in the direction from I‑93 to the South Boston Waterfront. Over the 12 hours between 6:00 AM and 6:00 PM, 4,347 vehicles travel in this direction, an average of only 362 vehicles per hour, well under the capacity for this type of road. Of these, 32 percent were trucks and light commercial vehicles, a percentage significantly higher than typically observed in urban traffic. This implies that Bypass Road provided particularly convenient access to destinations important to trucks.
Only 1,465 vehicles used Bypass Road in the direction of I‑93, which was 122 vehicles per hour. Trucks made up 59 percent of these, authorized buses and vans made up 4 percent, and private autos made up 37 percent of vehicles, even though autos are restricted from using Bypass Road in this direction. It was clear that there was capacity within Bypass Road to accommodate more traffic in this direction. However, with unrestricted use, the greatest number of private autos would be expected during the PM peak, which would exacerbate problems associated with the Southampton Street queue. Truck traffic had subsided significantly by the PM peak.
Bypass Road is patrolled by the Massachusetts State Police, and there is some enforcement activity. Voluntary compliance was hindered by ambiguous and missing signage.
The Widett Circle area is home of the New Boston Food Market, a cooperatively owned industrial park most of whose member firms distribute perishable foods. Relocation of these businesses has been considered in the past, and planning-level studies by the City of Boston or others might propose new uses. These businesses could move together to a different location, adding significant truck traffic at the new location. There is only one street connecting Widett Circle to the regional road network, so estimating truck trip generation only requires counting trucks at one location.
This study found that between 6:00 AM and 6:00 PM, 540 trucks and light commercial vehicles left Widett Circle. Some trucks may have left during the 12-hour night period, but no counting was done at that time. Over time, the numbers of trucks entering and leaving through the single entrance to the area will be the same.
Refrigerated trucks with six or more wheels were 59 percent of total trucks that left Widett Circle. Some of the light commercial vehicles were also refrigerated, but these vehicles types were not counted separately.
The Southampton Street bottleneck refers here to the 1.5-mile section of I‑93 southbound between the Southampton Street on-ramp and the start of the southbound Zipper Lane, a fifth lane that is available during the PM peak. The four lanes in this section are unable to accommodate the traffic approaching on both the I‑93 mainline and the heavily used Southampton Street entrance.
With the approaching traffic unable to enter this bottleneck section, queues develop behind the Southampton Street on-ramp merge during the PM peak. Depending on the level of traffic, these queues can extend back into approaching ramps, streets, and intersections, and are referred to here as queue systems. The queue system behind the Southampton Street on-ramp is especially problematic because it can reach the intersection of Massachusetts Avenue and Melnea Cass Boulevard, a critical arterial intersection in this part of Boston.
During the PM peak, the number of passenger vehicles increases for the commute home while the number of trucks decreases due to the many truck drivers that complete their daily itinerary before afternoon traffic reaches its peak. Trucks are comparatively less of a cause of these queues, and also as a group are less impacted.
Not only are trucks a small part of traffic in the Southampton Street entrance queue, but few of these trucks are entering the queue from Bypass Road. However, if use of Bypass Road was unrestricted, any meaningful increase in passenger vehicles going to I‑93 would lengthen the queue stretching towards the critical Massachusetts Avenue/Melnea Cass intersection.
One improvement being considered is to add an auxiliary, fifth southbound travel lane from Southampton Street to Columbia Road. This improvement could allow up to 600 more vehicles to enter I‑93 at Southampton Street between 3:00 PM and 6:00 PM. The increase in vehicles entering at Southampton Street would be matched by a decrease in vehicle flow on the approaching I‑93 mainline, but it could also lengthen mainline queues.
To shorten the two queue systems approaching the Southampton Street entrance, it would be necessary to add a fifth lane all the way through the bottleneck section to match the five lanes available during the PM peak when the Zipper Lane is in operation. This would be an expensive project that would require some land takings and rail line relocation.
Data collection for this study began before the COVID-19 social distancing mandates started to close major sectors of public and business activity, and was completed as limitations on activity reached the most restrictive. The sample structure and dates of data collection just happened to provide a number of time periods where a pair of similar counts were performed on two days separated by 9 to 21 days. Comparing truck volumes of the earlier counts with the later counts provided an estimate of the decline in truck activity during that phase of the public health crisis, and served as a basis to evaluate the usefulness of these data.
Using the combined truck volumes of the six earlier-later count pairs, truck volumes declined about nine percent between the two count groups. The truck volumes presented in the memorandum were calculated from all counts collected in the field. If truck volumes had continued at the initial level throughout the data gathering phase, the truck numbers presented in this memorandum might have been between four and five percent higher. A shortfall of this magnitude was considered acceptable for this study due to the many important findings related to the patterns of vehicle flows and the estimated volumes.
South Bay provides a positive example of how truck traffic can be accommodated and managed. The CA/T envisioned modern infrastructure configured for the needs of local and regional logistic and heavy vehicle activity. South Boston Bypass Road was planned as a truck-only corridor. This study suggests that its value to trucks is not that autos had been prohibited, but rather that it provides efficient access to locations trucks need to go. The unrestricted northbound use being recommended by the NPC presented no traffic problems during this pilot period, and the southbound direction could also be unrestricted if the problems of the Southampton Street bottleneck were solved.
Trucks and passenger vehicles share the region’s road system, and problems with the system are problems for all users. Many trucks avoid PM peak congestion problems simply because truck drivers tend to schedule their travel itineraries earlier in the day. However, trucks are fully represented in any congestion that occurs in the morning, and increasingly, midday periods.
The two parts of I‑93 analyzed in this study, the newer Central Artery and the older Southeast Expressway, together with South Boston Bypass Road, are all appropriately parts of the NHFN. Trucks operate almost everywhere in the road network, but serious problems within the NHFN, such as the Southampton Street bottleneck, merit consideration as freight planning issues.
1 Boston Region Metropolitan Planning Organization (website), Proposed Critical Urban Freight Corridors, May 2017. Accessed 30 October 2020. https://www.bostonmpo.org/data/calendar/pdfs/2017/MPO_0525_Draft_Critical_Urban_Freight_Corridors.pdf.
2 Boston Region Metropolitan Planning Organization (website), Improving the Southeast Expressway: A Conceptual Plan, February 2012. Accessed 30 October 2020. http://bostonmpo.org/Drupal/se_expr_concept.
The Boston Region Metropolitan Planning Organization (MPO) operates its programs, services, and activities in compliance with federal nondiscrimination laws including Title VI of the Civil Rights Act of 1964 (Title VI), the Civil Rights Restoration Act of 1987, and related statutes and regulations. Title VI prohibits discrimination in federally assisted programs and requires that no person in the United States of America shall, on the grounds of race, color, or national origin (including limited English proficiency), be excluded from participation in, denied the benefits of, or be otherwise subjected to discrimination under any program or activity that receives federal assistance. Related federal nondiscrimination laws administered by the Federal Highway Administration, Federal Transit Administration, or both, prohibit discrimination on the basis of age, sex, and disability. The Boston Region MPO considers these protected populations in its Title VI Programs, consistent with federal interpretation and administration. In addition, the Boston Region MPO provides meaningful access to its programs, services, and activities to individuals with limited English proficiency, in compliance with U.S. Department of Transportation policy and guidance on federal Executive Order 13166. The Boston Region MPO also complies with the Massachusetts Public Accommodation Law, M.G.L. c 272 sections 92a, 98, 98a, which prohibits making any distinction, discrimination, or restriction in admission to, or treatment in a place of public accommodation based on race, color, religious creed, national origin, sex, sexual orientation, disability, or ancestry. Likewise, the Boston Region MPO complies with the Governor's Executive Order 526, section 4, which requires that all programs, activities, and services provided, performed, licensed, chartered, funded, regulated, or contracted for by the state shall be conducted without unlawful discrimination based on race, color, age, gender, ethnicity, sexual orientation, gender identity or expression, religion, creed, ancestry, national origin, disability, veteran's status (including Vietnam-era veterans), or background. A complaint form and additional information can be obtained by contacting the MPO or at http://www.bostonmpo.org/mpo_non_discrimination. To request this information in a different language or in an accessible format, please contact Title VI Specialist |